Anomaly Detection in Endpoint analytics
Note
This capability is available as an Intune add-on. For more information, see Intune add-ons.
This article explains how anomaly detection in Endpoint analytics works as an early warning system.
Anomaly detection monitors the health of devices in your organization for user experience and productivity regressions following configuration changes. When a failure occurs, Anomalies correlates relevant deployment objects to enable rapid troubleshooting, suggest root causes and remediation.
Administrators can rely on anomaly detection to learn about user experience impacting issues before it reaches them through other channels. The initial focus for anomaly detection is on Application hangs/ crashes and Stop Error Restarts.
Overview
With anomaly detection, you can detect potential problems in a system before they become a serious issue. Traditionally, support teams have limited visibility into potential problems.
often, they only get a subset of the issues reported/ escalated through the support channel, which isn't truly representative of everything going on in your organization.
they must spend countless hours reviewing custom dashboards trying to identify the root cause, troubleshoot, create custom alerts, change thresholds, and tweak parameters.
Anomaly detection aims at addressing these problems by enabling IT admins with critical information.
In addition to detecting anomalies, you can view device correlation groups to explore potential root causes for medium and high severity anomalies. These device cohorts allow you to view patterns identified among devices. We have taken a proactive approach to device management by also identifying devices "at risk" in those cohorts. These are the devices that fall under the identified patterns with high confidence but haven't seen those anomalies yet.
Note
Device cohorts are only identified for medium and high severity anomalies.
Prerequisites
Licensing/Subscriptions: The advanced features in Endpoint analytics are included as an Intune-add on under Microsoft Intune Suite and requires an extra cost to the licensing options that include Microsoft Intune.
Permissions: Anomaly detection uses built-in role permissions
Anomalies tab
Sign in to the Microsoft Intune admin center.
Select Report > Endpoint analytics > Overview.
Select Anomalies tab. The Anomalies tab provides a quick overview of the anomalies detected in your organization.
In this example, the Anomalies tab shows an anomaly with medium severity impact. You can add filters to refine the list.
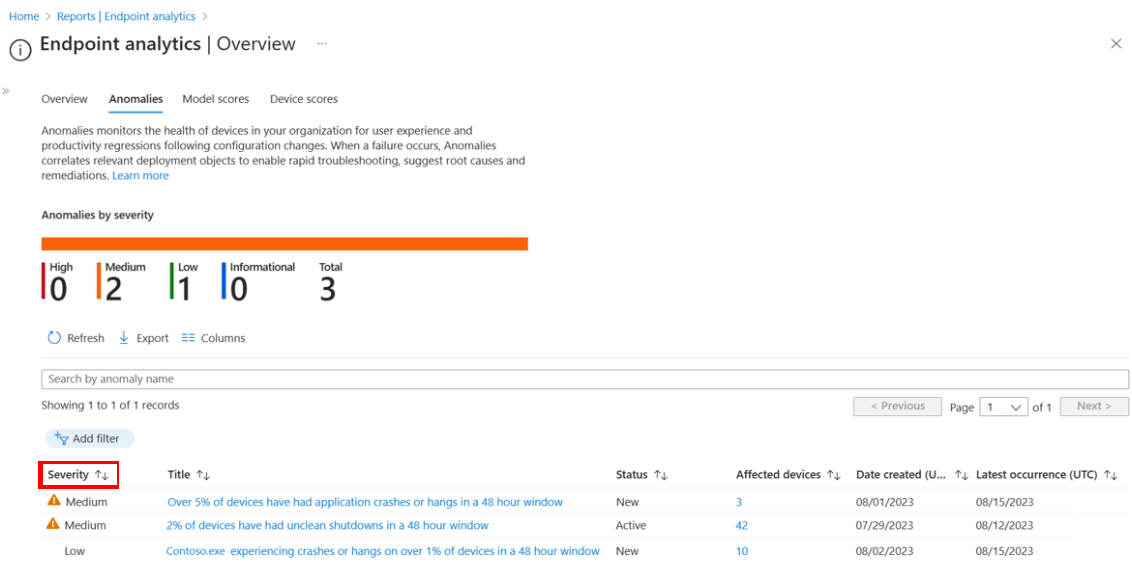
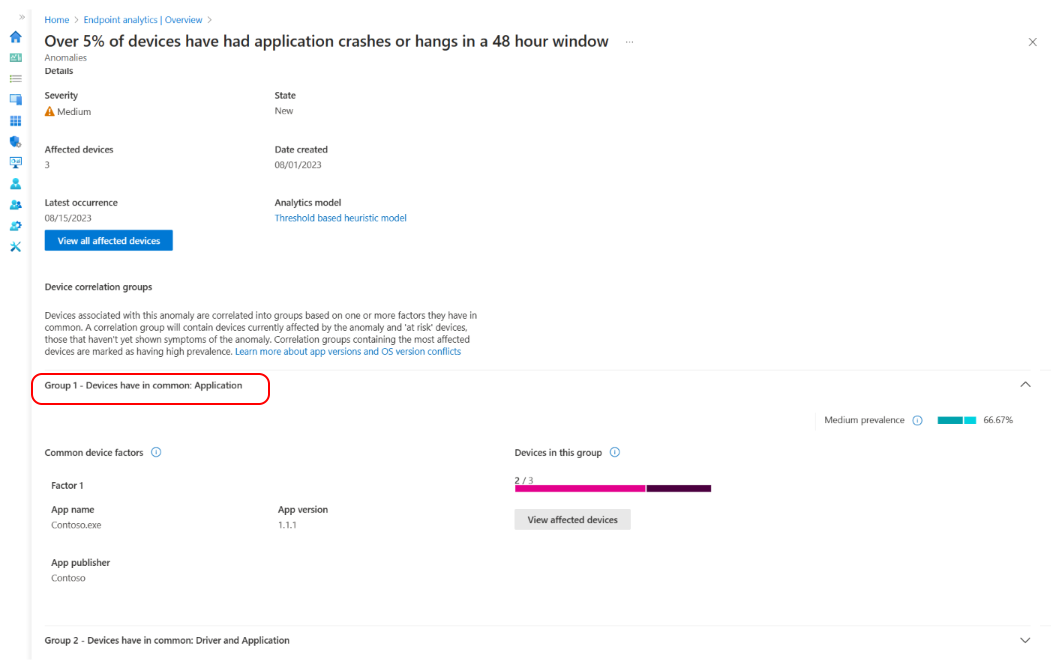
To see more information about a specific item, choose it from the list. You can see details like the name of the app, which devices are affected, when the issue was first detected and last occurred, and any device groups that might be contributing to the problem.

Select a device correlation group from the list for a detailed view of the devices' common factors. Devices are correlated based on one or more shared attributes such as app version, driver update, OS version and device model. You can see the number of devices currently affected by the anomaly and devices at risk of experiencing the anomaly. The prevalence rate also shows you the percentage of affected devices from an anomaly that are members of a correlation group.
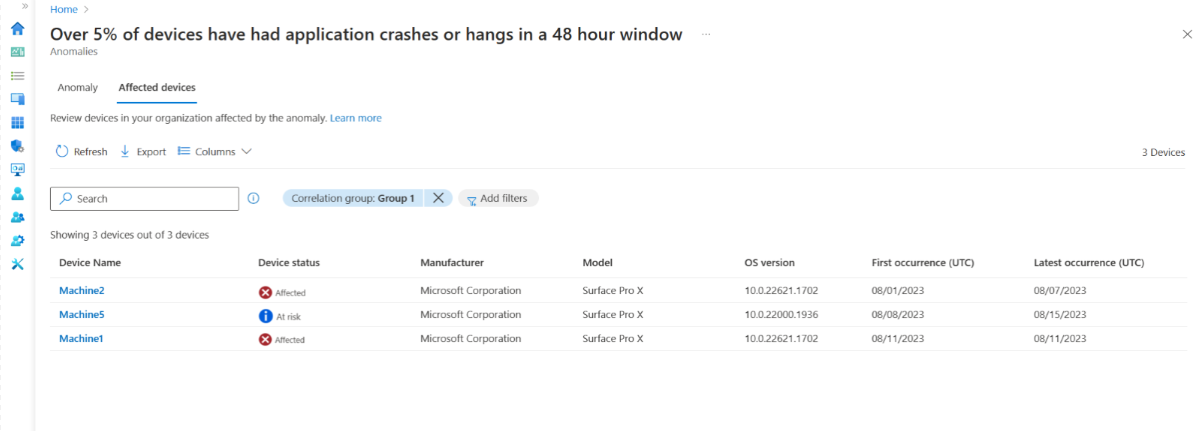
Select View Affected Devices to display a list of devices with key attributes relevant to each device. You can filter to view devices in specific correlation groups or show all devices affected by that anomaly in your organization. Additionally, the device timeline shows more anomalous events.


Statistical Models for determining anomalies
The Analytical Model built detects device cohorts facing anomalous set of stop error restarts and application hangs/ crashes that need admin attention to mitigate and resolve. Patterns identified from our sensor telemetry and diagnostics logs determine these device cohorts
Threshold based heuristic model: The heuristic model involves setting one or more threshold values for Application Hangs/Crashes or Stop Error Restarts. Devices are flagged as anomalous if there's a breach in the above set threshold. The model is simple yet effective; it's suited in surfacing prominent or static issues with devices or their apps. Currently, the thresholds are predetermined without an option to customize.
Paired t-tests model: Paired t-tests are a mathematical method that compares pairs of observations in a dataset, looking for a statistically significant distance between their means. Tests are used on datasets that consist of observations related to each other in some way. For example, count of Stop Error Restarts from the same device before and after a policy change, or app crashes on a device after an OS (operating systems) update.
Population Z-score model: Population Z-score based statistical models involve calculating the standard deviation and mean of a dataset, and then using those values to determine which data points are anomalous. Standard deviation and mean are used to calculate the Z-score for each data point, which represents the number of standard deviations away from the mean. Data points that fall outside a certain range are anomalous. This model is well suited in highlighting outlier devices or apps from the wider baseline but requires sufficiently large datasets to be accurate.
Time Series Z-score model: Time series Z-score models are a variation of the standard Z-score model designed for detecting anomalies in time series data. Time series data is a sequence of data points collected at regular intervals over time, such as aggregate of Stop Error Restarts. Standard deviation and mean are calculated for a sliding window of time, using aggregated metrics. This method allows the model to be sensitive to temporal patterns in the data and adapt to changes in its distribution over time.
Next steps
For more information, go to:
Feedback
Coming soon: Throughout 2024 we will be phasing out GitHub Issues as the feedback mechanism for content and replacing it with a new feedback system. For more information see: https://aka.ms/ContentUserFeedback.
Submit and view feedback for