Note
Access to this page requires authorization. You can try signing in or changing directories.
Access to this page requires authorization. You can try changing directories.
Carefully creating and formatting a table using streaming data allows you to purposefully structure the information for storage and analysis.
In this tutorial, you learn how to:
- Use named ranges to refer to ranges of streaming data.
- Create a blank table on a separate Excel sheet.
- Use structured references to fill table with streaming data values from Data In named ranges.
Prerequisites
- Data Streamer Enabled
- Sensor data streaming into Data In page of Excel
Define Named Ranges for Streaming Data
- Open the Data In worksheet in your workbook.
- Select the full data range under Historical Data, including the headers found in row 7.
- Go to Formulas > Create from Selection.
- In the Create Names from Selection dialog box, designate the location that contains the labels by selecting the Top row checkbox.
- Select OK.
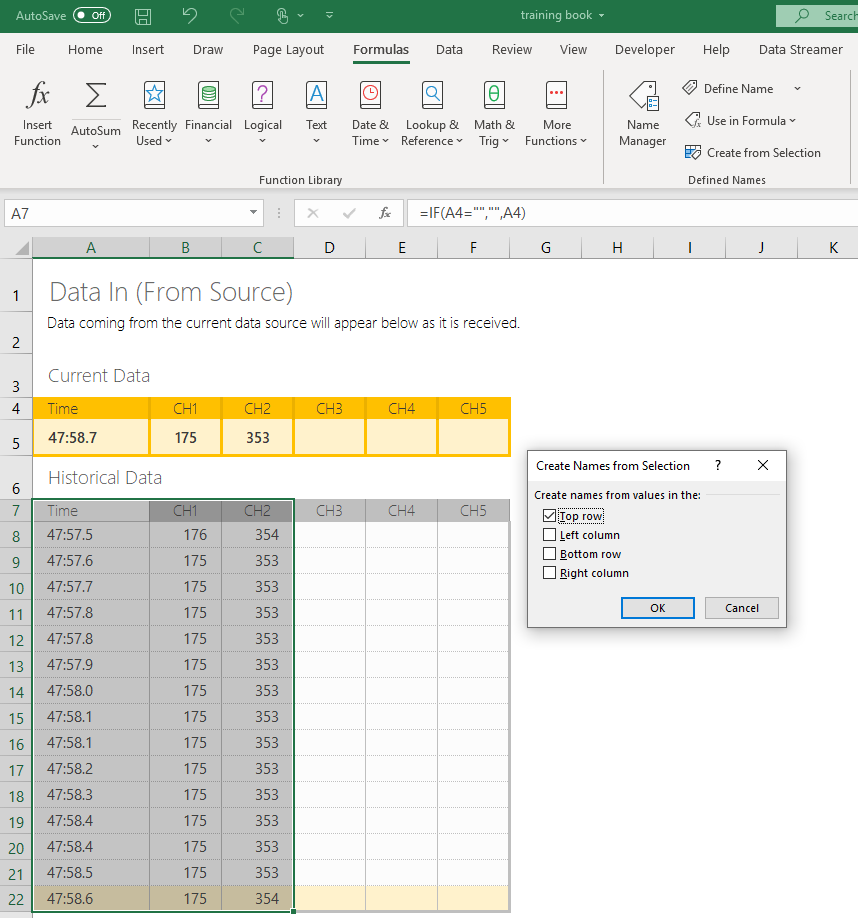
Excel names the cell ranges based on the channel labels. These can be adjusted later in Formulas > Name Manager.
Create Blank Table
- In a blank worksheet, select a cell and type Time to be your first column name.
- Continuing one cell right, type the name of your first data column.
- Repeat for all desired data channels from Data In.
- With one header cell selected, go to Insert > Table.
- Select from your Time header and drag to add the necessary number of data rows to match Data In. Alternatively, just replace the last number in the range selection to include all desired rows.
- Check the box for My table has headers.
- Select OK.
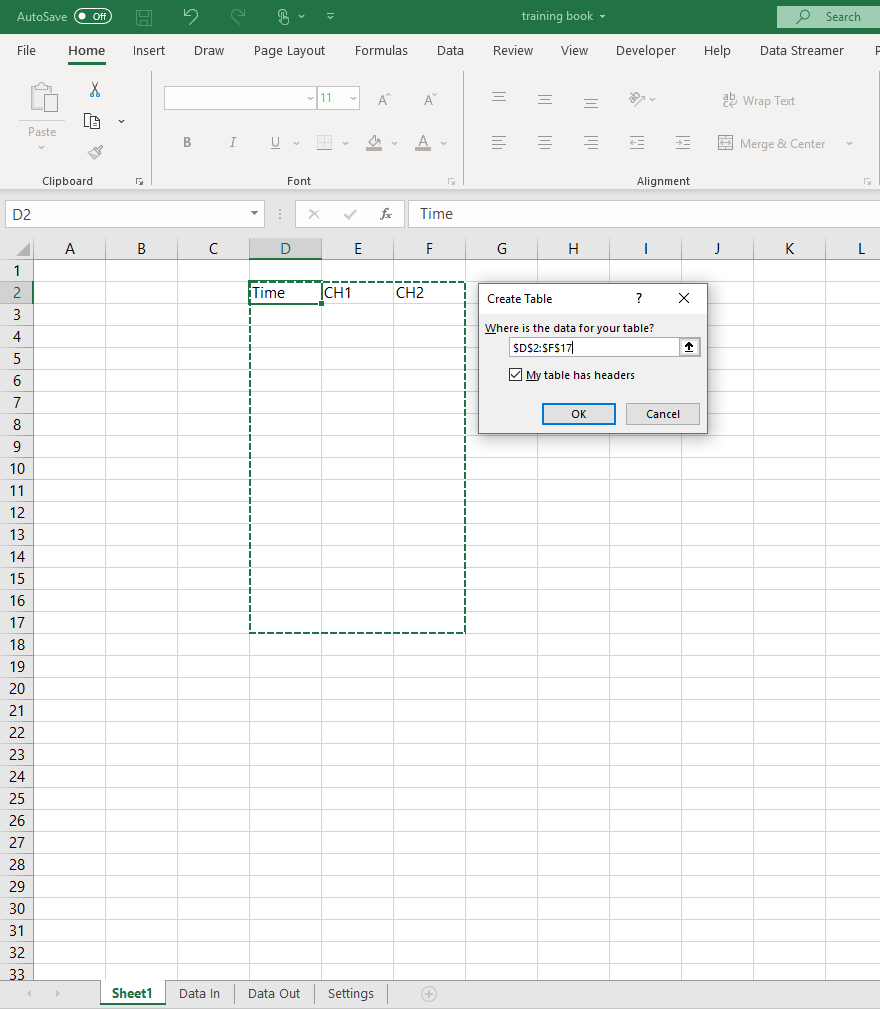
This worksheet now has a blank table, which can now be filled through formulas.
Fill Table with Streaming Data Values
- In a cell outside of your table, note the rate in seconds of your streaming data. [#Note]Ex: if you have a 20 ms interval between data, remember that your rate is .02.
- Name this cell as
DataRate. - In a cell in the Time column, enter the formula
=(ROW()-ROW([#Headers])-1)*DataRate. This gives you a consistent time interval for your data. - In the second column, enter the formula
=INDEX(CH1_,ROW()-ROW([#Headers])). - Repeat for all desired channels of named ranges, replacing CH1_ with the valid named ranges.
This table is now filled with streaming data.