Diagnosing performance issues with SharePoint
This article shows you how you can diagnose common issues with your SharePoint site using Internet Explorer developer tools.
There are four different ways that you can identify that a page on a SharePoint site has a performance problem with the customizations.
The Page Diagnostics for SharePoint tool
The F12 tool bar network monitor
Comparison to a noncustomized baseline
SharePoint response header metrics
This article describes how to use each of these methods to diagnose performance issues. Once you've figured out the cause of the problem, you can work toward a solution using the articles about improving SharePoint performance that you can find on https://aka.ms/tune.
Use the Page Diagnostics for SharePoint tool
The Page Diagnostics for SharePoint tool is a browser extension for Microsoft Edge (https://www.microsoft.com/edge) and Chrome browsers that analyzes both SharePoint modern portal and classic publishing site pages.
Important
This tool only works for SharePoint in Microsoft 365, and can’t be used on a SharePoint system page or on a SharePoint App page. The App page type is designed to be used for specific business applications within SharePoint and not for portals. The tool is designed to optimize portal pages and Teams site pages.
The tool generates a report for each analyzed page showing how the page performs against a predefined set of rules and displays detailed information when results for a test fall outside the baseline value. SharePoint administrators and designers can use the tool to troubleshoot performance issues and to ensure that new pages are optimized prior to publishing.
For more information about how to install and use the tool, see Page Diagnostics for SharePoint tool.
Using the F12 tool bar to diagnose performance in SharePoint
In this article, we use Internet Explorer 11. Versions of the F12 developer tools on other browsers have similar features though they might look slightly different. For information on the F12 developer tools, see:
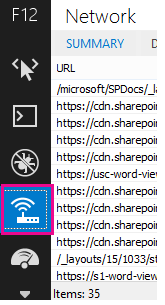
To bring up the developer tools press F12 and then click the Wi-Fi icon:
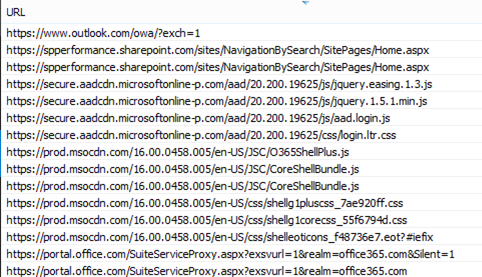
On the Network tab, press the green play button to load a page. The tool returns all of the files that the browser requests in order to get the page you asked for. The following screenshot shows one such list.
You can also see the download times of the files on the right side as shown in this screenshot.
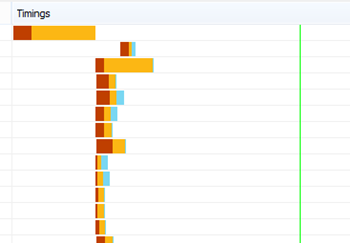
This gives you a visual representation of how long the file took to load. The green line represents when the page is ready to be rendered by the browser. This can give you a quick view of the different files that might be causing slow page loads on your site.
Setting up a noncustomized baseline for SharePoint
The best way to determine your site's performance weak points is to set up a completely out-of-the-box site collection in SharePoint. This way you can compare all the various aspects of your site with what you would get with no customization on the page. The OneDrive for Business home page is a good example of a separate site collection that is unlikely to have any customizations.
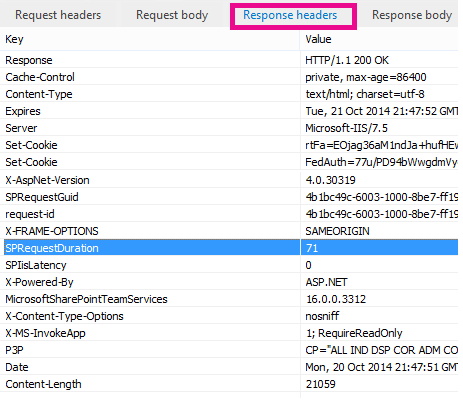
Viewing SharePoint response header information
In SharePoint, you can access the information that is sent back to the browser in the response header for each file. The most useful value for diagnosing performance issues is SPRequestDuration, which displays the amount of time that the request took on the server to be processed. This can help determine if the request is heavy and resource intensive. This is the best insight you have into how much work the server is doing to serve the page.
To view SharePoint response header information
Ensure that you have the F12 tools installed. For more information on downloading and installing these tools, see What's new in F12 tools.
In the F12 tools, on the Network tab, press the green play button to load a page.
Click one of the .aspx files returned by the tool and then click DETAILS.
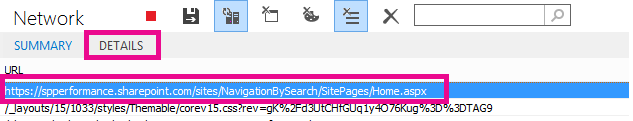
Click Response headers.
What's causing performance issues in SharePoint?
The article Navigation options for SharePoint shows an example of using the SPRequestDuration value to determine that the complicated structural navigation was causing the page to take a long time to process on the server. By taking a value for a baseline site (without customization), it's possible to determine if any given file is taking a long time to load. The example used in Navigation options for SharePoint is the main .aspx file. That file contains most of the ASP.NET code that runs for your page load. Depending on the site template you use, this could be start.aspx, home.aspx, default.aspx, or another name if you customize the home page. If this number is considerably higher than your baseline site, then it's a good indication that there's something complex going on in your page that is causing performance issues.
Once you've identified that an issue specific to your site, the recommended way to figure out what is causing poor performance is to eliminate all of the possible causes, like page customizations, and then add them back to the site one by one. Once you have removed enough customizations that the page is performing well, you can then add back specific customizations one by one.
For example, if you have a complex navigation try changing the navigation to not show subsites then check the developer tools to see if this makes a difference. Or if you have a large number of content roll-ups try removing them from your page and see if this improves things. If you eliminate all of the possible causes and add them back in one at a time, you can easily identify which features are the biggest problem and then work towards a solution.