Note
Access to this page requires authorization. You can try signing in or changing directories.
Access to this page requires authorization. You can try changing directories.
Applies to:
Note
Want to experience Defender for Endpoint? Sign up for a free trial.
The Defender for Endpoint device timeline helps you research and investigate anomalous behavior on your devices more quickly. You can explore specific events and endpoints to review potential attacks in your organization. You can review specific times of each event, set flags to follow up for potentially connected events, and filter to specific date ranges.
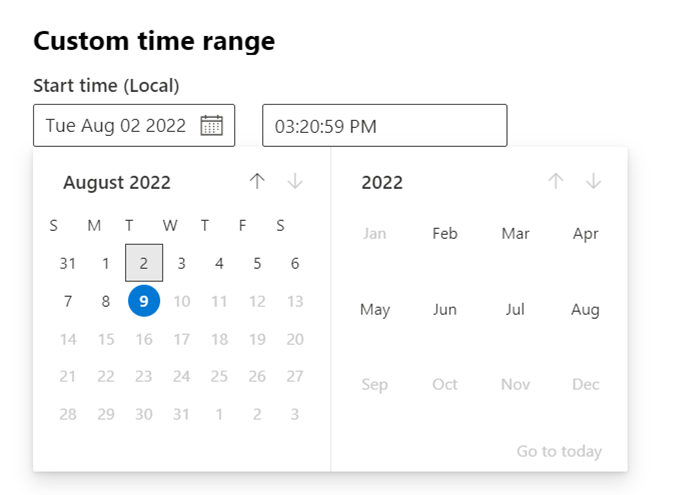
Custom time range picker:
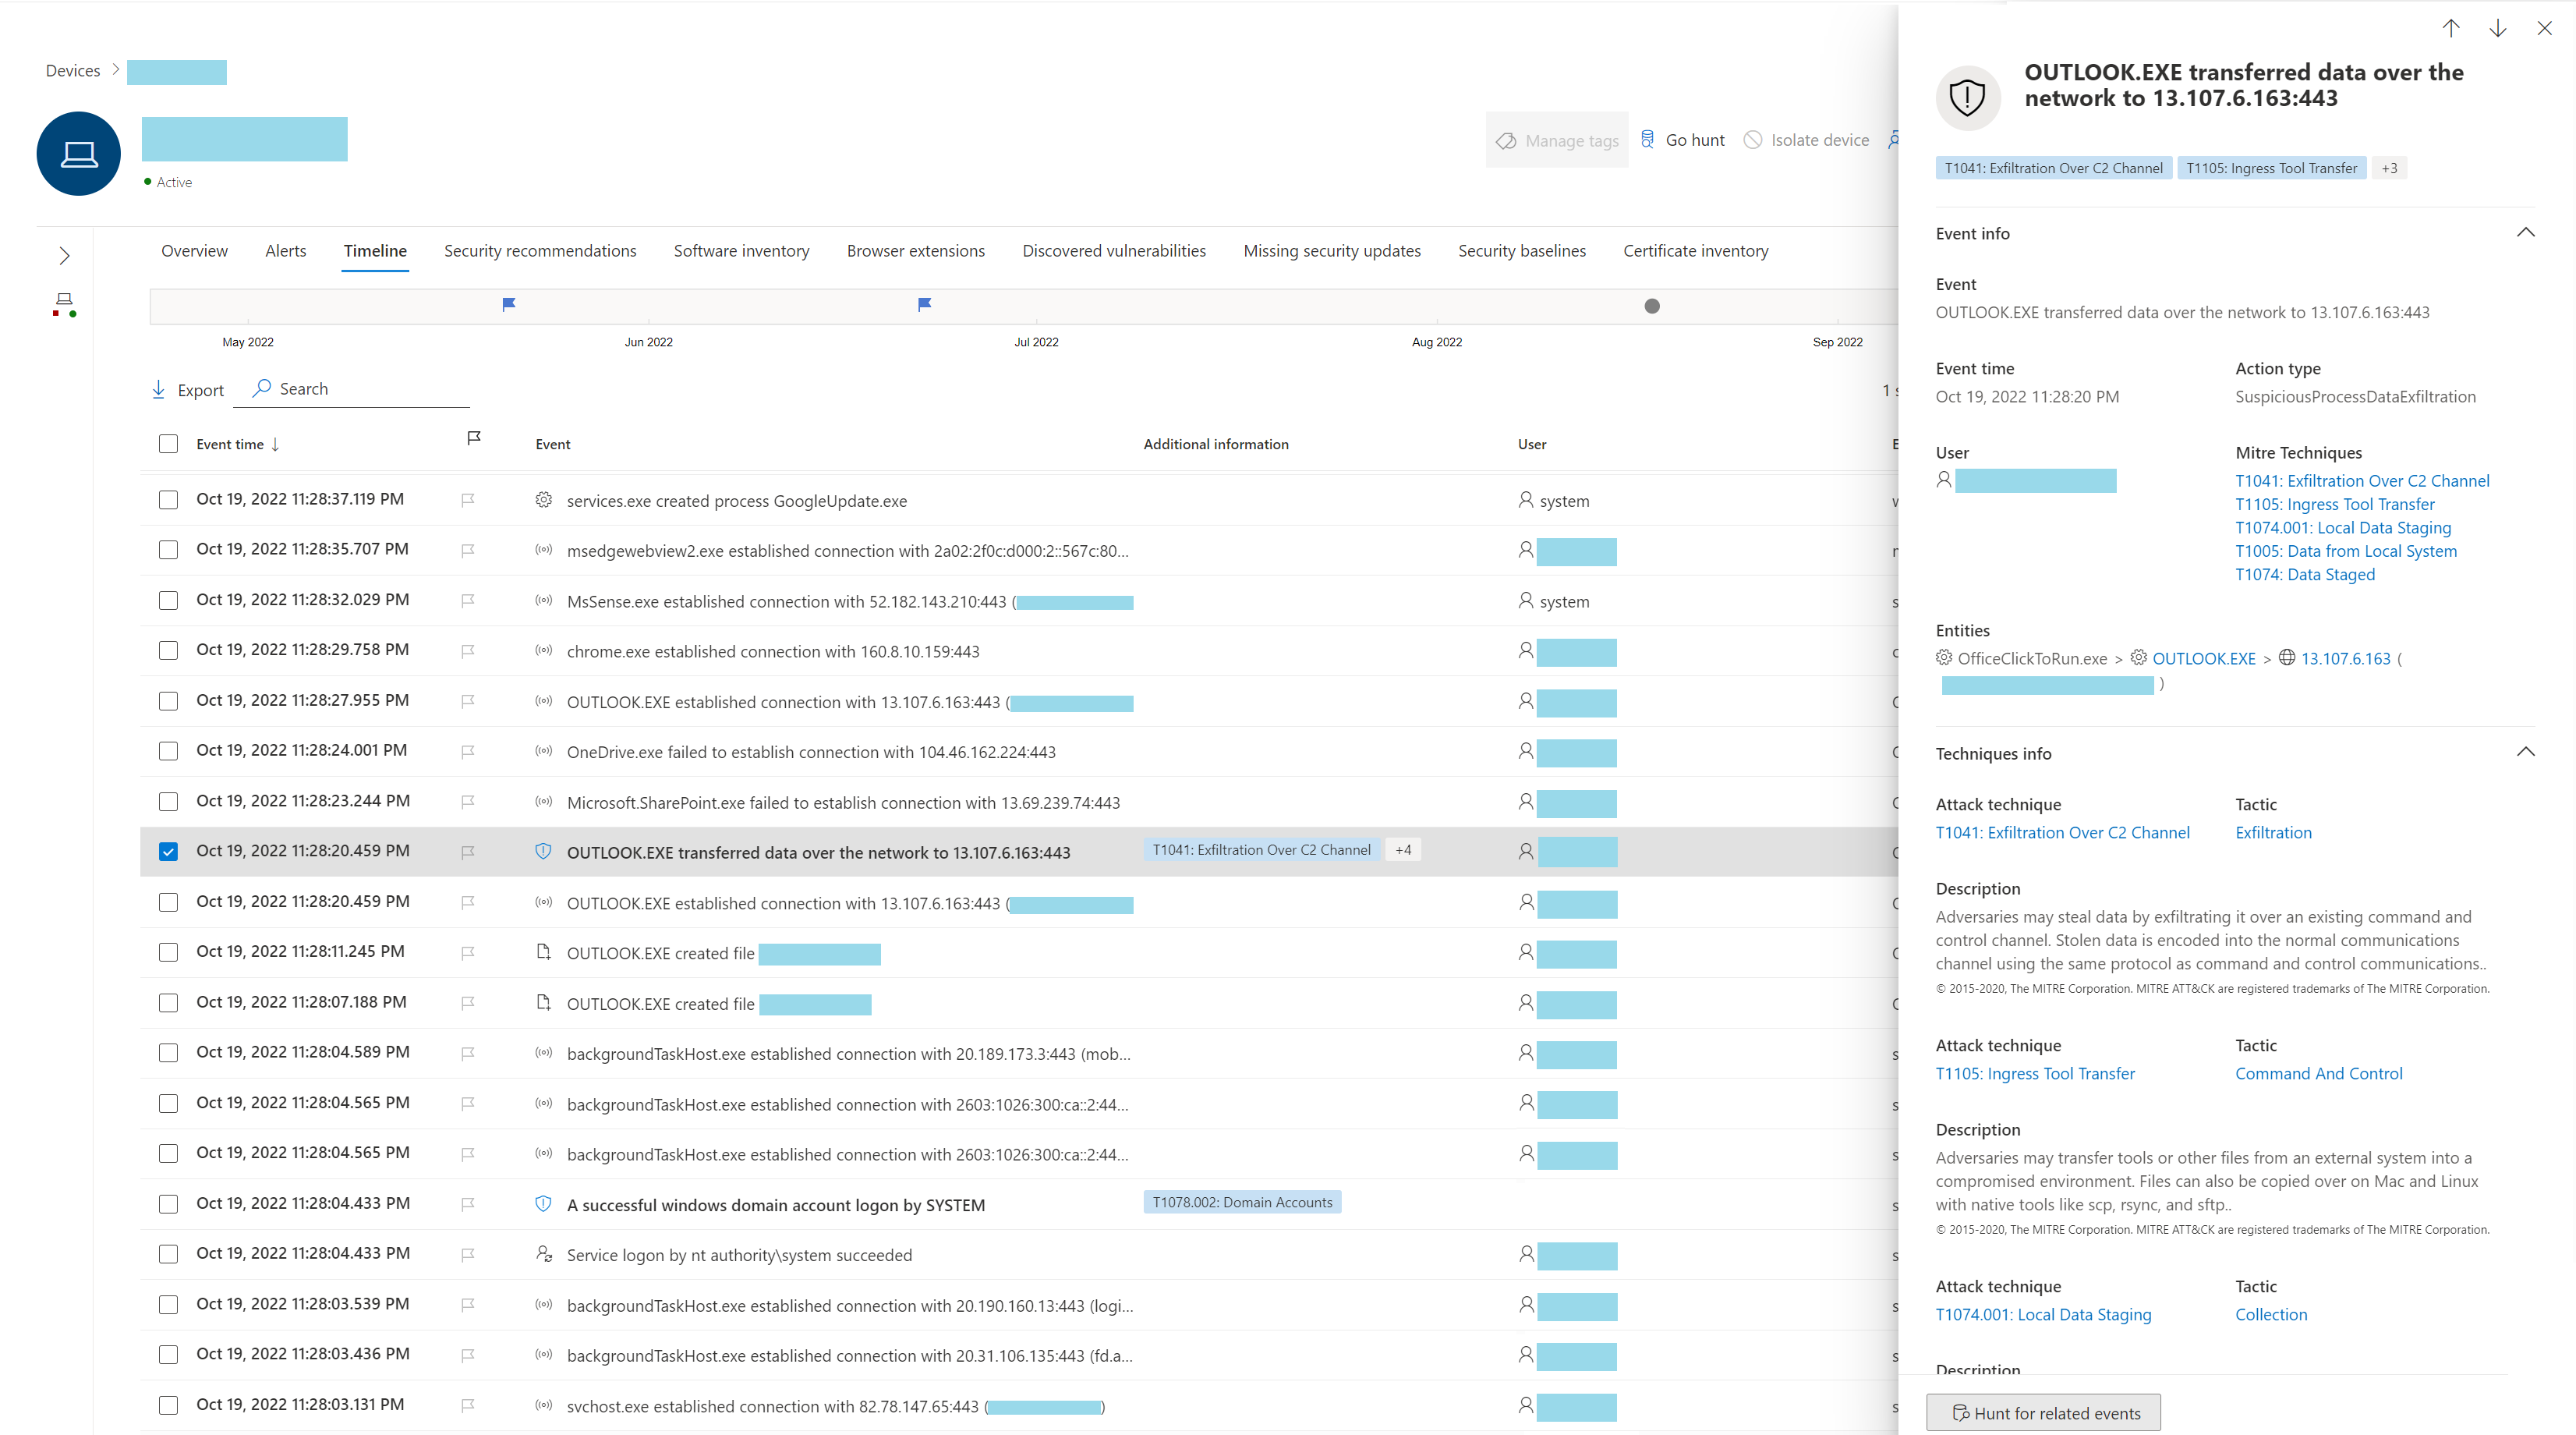
Process tree experience – event side panel:

All MITRE techniques are shown when there's more than one related technique:
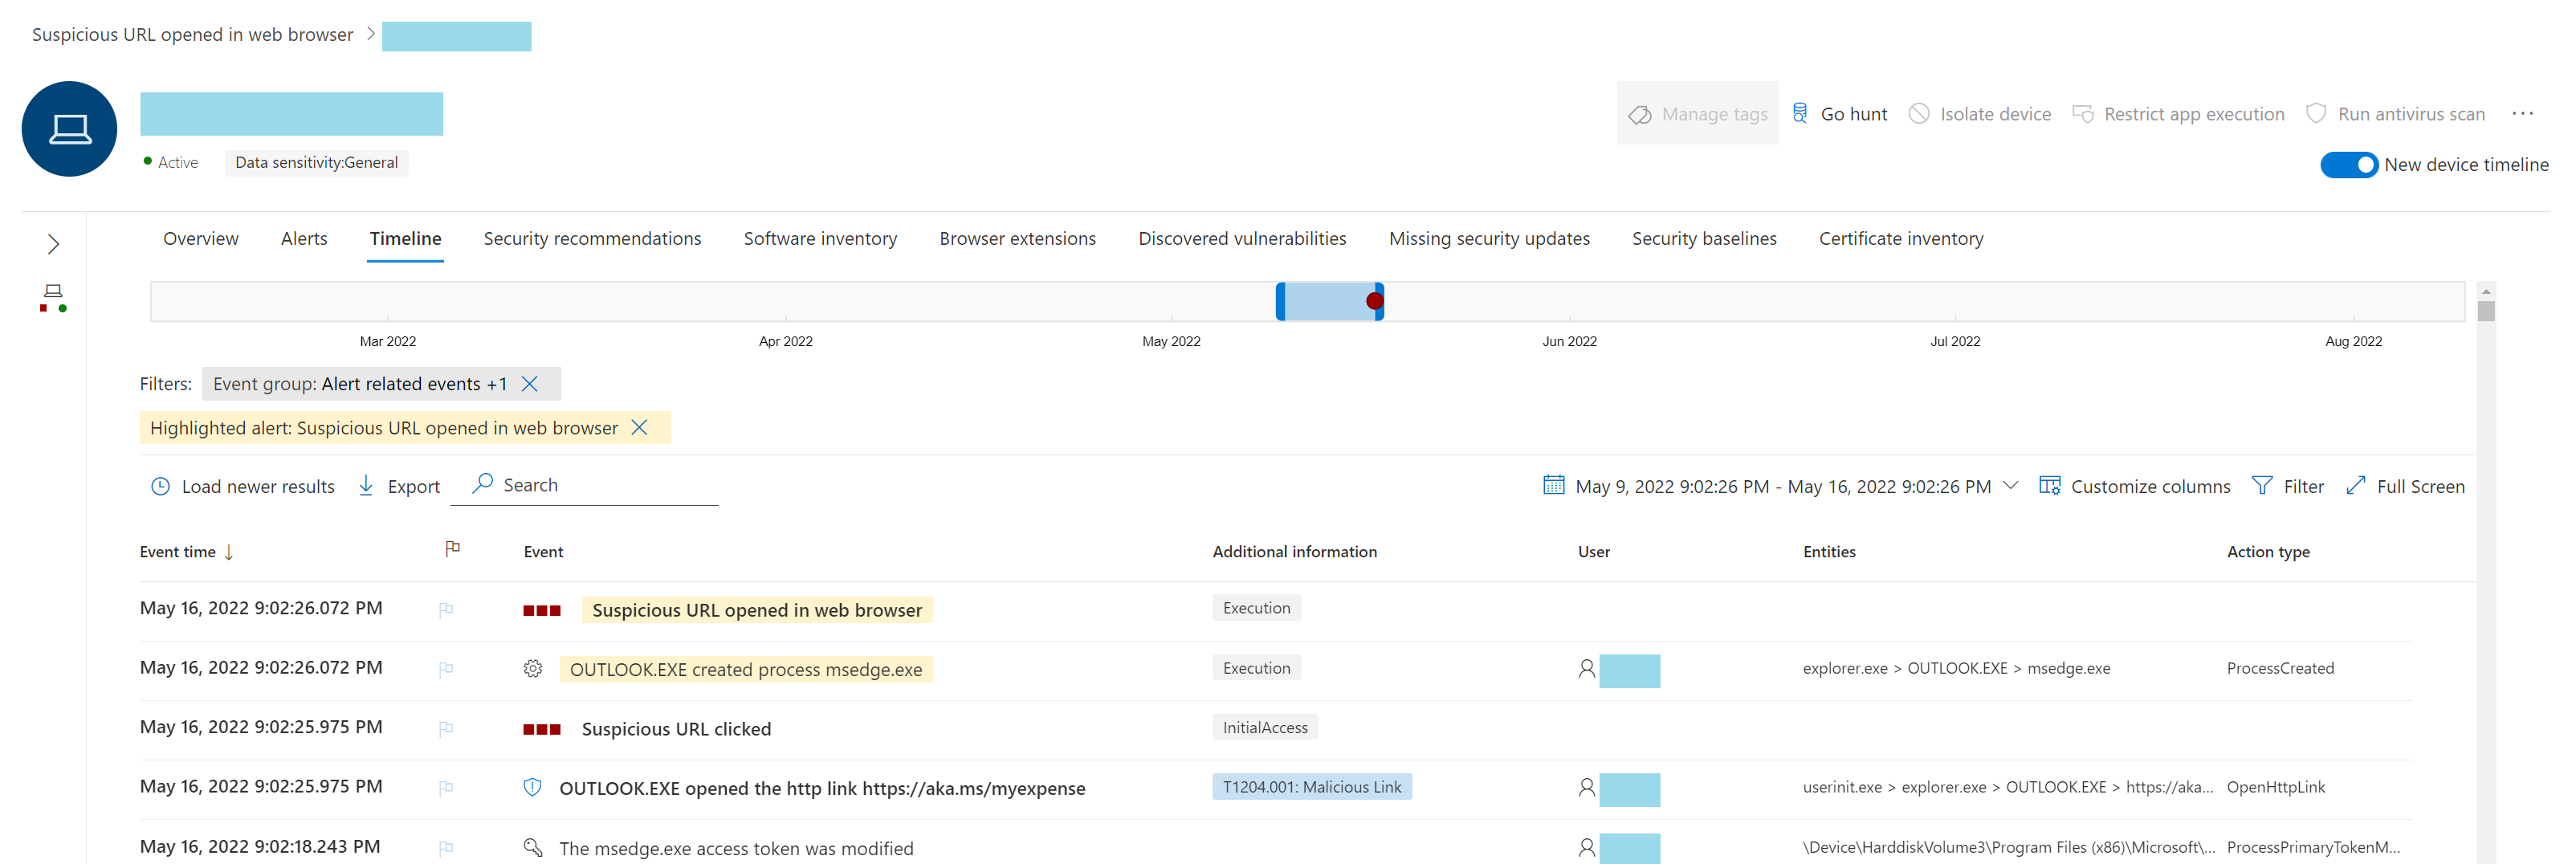
Timeline events are linked to the new user page:


Defined filters are now visible at the top of the timeline:


Techniques in the device timeline
You can gain more insight in an investigation by analyzing the events that happened on a specific device. First, select the device of interest from the Devices list. On the device page, you can select the Timeline tab to view all the events that occurred on the device.
Understand techniques in the timeline
Important
Some information relates to a prereleased product feature in public preview which may be substantially modified before it's commercially released. Microsoft makes no warranties, express or implied, with respect to the information provided here.
In Microsoft Defender for Endpoint, Techniques are an additional data type in the event timeline. Techniques provide more insight on activities associated with MITRE ATT&CK techniques or subtechniques.
This feature simplifies the investigation experience by helping analysts understand the activities that were observed on a device. Analysts can then decide to investigate further.
During preview, Techniques are available by default and shown together with events when a device's timeline is viewed.

Techniques are highlighted in bold text and appear with a blue icon on the left. The corresponding MITRE ATT&CK ID and technique name also appear as tags under Additional information.
Search and Export options are also available for Techniques.
Investigate using the side pane
Select a Technique to open its corresponding side pane. Here you can see additional information and insights like related ATT&CK techniques, tactics, and descriptions.
Select the specific Attack technique to open the related ATT&CK technique page where you can find more information about it.
You can copy an entity's details when you see a blue icon on the right. For instance, to copy a related file's SHA1, select the blue page icon.


You can do the same for command lines.

Investigate related events
To use advanced hunting to find events related to the selected Technique, select Hunt for related events. This leads to the advanced hunting page with a query to find events related to the Technique.

Note
Querying using the Hunt for related events button from a Technique side pane displays all the events related to the identified technique but does not include the Technique itself in the query results.
EDR client (MsSense.exe) Resource Manager
When the EDR client on a device is running low on resources, it enters critical mode to maintain the normal working operation of the device. The device won't process new events until the EDR client returns to a normal state. A new event appears in the Timeline for that device indicating that the EDR client switched to Critical mode.
When the EDR client's resource usage goes back to normal levels, it will automatically return to normal mode.
Customize your device timeline
On the upper right-hand side of the device timeline, you can choose a date range to limit the number of events and techniques in the timeline.
You can customize which columns to expose. You can also filter for flagged events by data type or by event group.
Choose columns to expose
You can choose which columns to expose in the timeline by selecting the Choose columns button.

From there you can select which information set to include.
Filter to view techniques or events only
To view only either events or techniques, select Filters from the device timeline and choose your preferred Data type to view.

Timeline event flags
Event flags in the Defender for Endpoint device timeline help you filter and organize specific events when you're investigating potential attacks.
The Defender for Endpoint device timeline provides a chronological view of the events and associated alerts observed on a device. This list of events provides full visibility into any events, files, and IP addresses observed on the device. The list can sometimes be lengthy. Device timeline event flags help you track events that could be related.
After you've gone through a device timeline, you can sort, filter, and export the specific events that you flagged.
While navigating the device timeline, you can search and filter for specific events. You can set event flags by:
- Highlighting the most important events
- Marking events that require deep dive
- Building a clean breach timeline
Flag an event
Find the event that you want to flag.
Select the flag icon in the Flag column.

View flagged events
- In the timeline Filters section, enable Flagged events.
- Select Apply. Only flagged events are displayed.
You can apply more filters by clicking on the time bar. This will only show events prior to the flagged event.

Tip
Do you want to learn more? Engage with the Microsoft Security community in our Tech Community: Microsoft Defender for Endpoint Tech Community.