Report and troubleshoot Defender for Endpoint attack surface reduction rules
Applies to:
- Microsoft Defender for Endpoint Plan 1
- Microsoft Defender for Endpoint Plan 2
- Microsoft Defender XDR
The Microsoft Defender portal is the new interface for monitoring and managing security across your Microsoft identities, data, devices, apps, and infrastructure. Here you can easily view the security health of your organization, act to configure devices, users, and apps, and get alerts for suspicious activity. The Microsoft Defender portal is intended for security admins and security operations teams to better manage and protect their organization. Visit the Microsoft Defender portal athttps://security.microsoft.com.
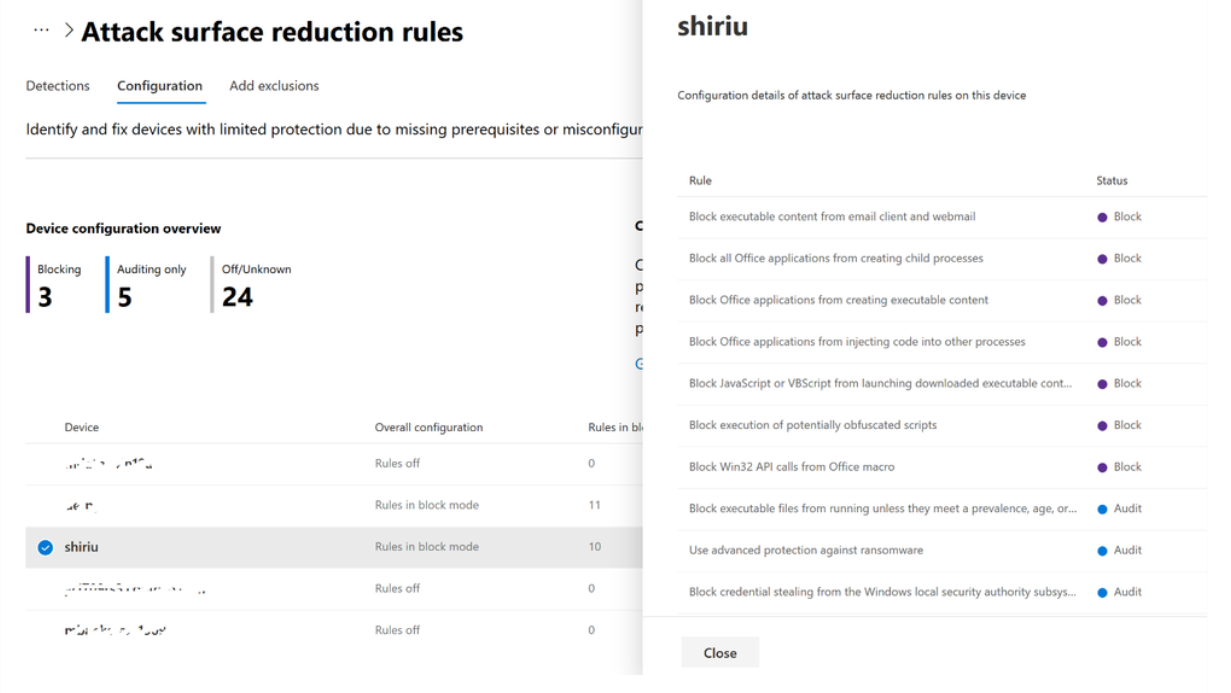
In Microsoft Defender portal, we offer you a complete look at the current attack surface reduction rules configuration and events in your estate. Your devices must be onboarded into the Microsoft Defender for Endpoint service for these reports to be populated. Here's a screenshot from the Microsoft Defender portal (under Reports > Devices > Attack surface reduction). At the device level, select Configuration from the Attack surface reduction rules pane. The following screen is displayed, where you can select a specific device and check its individual attack surface reduction rule configuration.
Microsoft Defender for Endpoint - Advanced hunting
One of the most powerful features of Microsoft Defender for Endpoint is advanced hunting. If you're unfamiliar with advanced hunting, refer proactively hunt for threats with advanced hunting.
Advanced hunting is a query-based (Kusto Query Language) threat-hunting tool that lets you explore up to 30 days of the captured (raw) data, that Defender for Endpoint collects from your devices. Through advanced hunting, you can proactively inspect events to locate interesting indicators and entities. The flexible access to data helps unconstrained hunting for both known and potential threats.
Through advanced hunting, it's possible to extract attack surface reduction rules information, create reports, and get in-depth information on the context of a given attack surface reduction rule audit or block event.
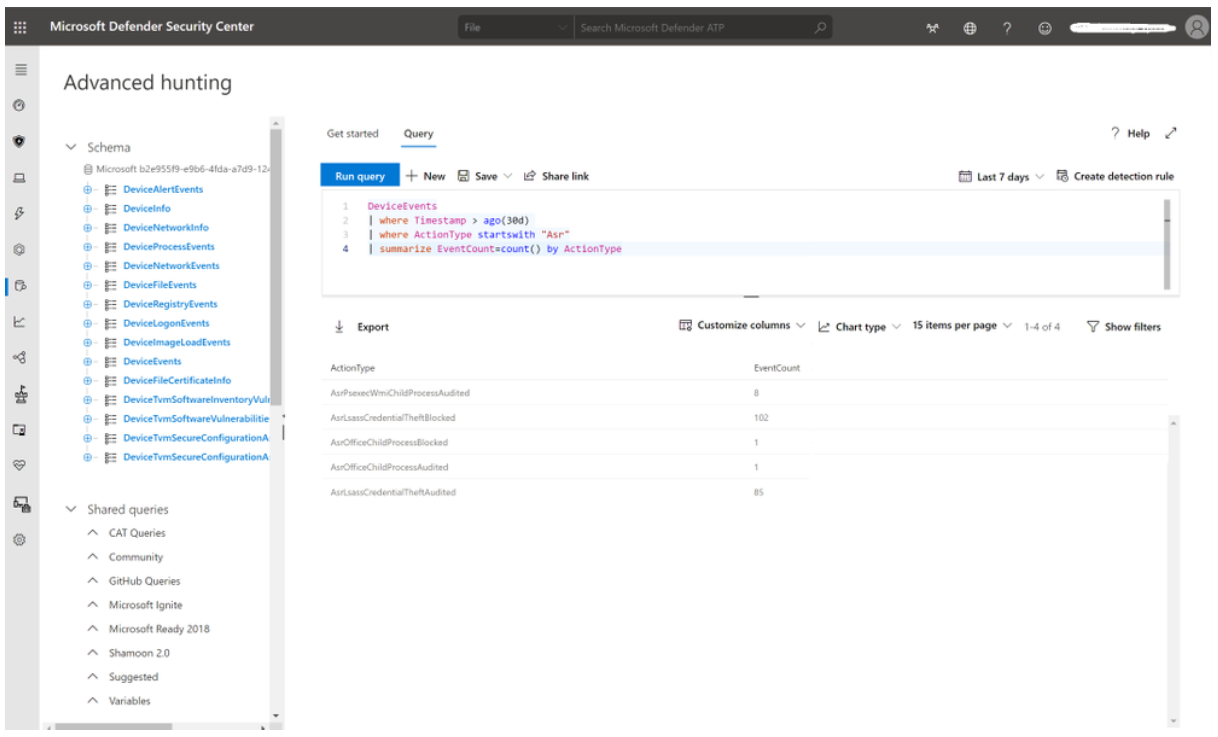
Attack surface reduction rules events are available to be queried from the DeviceEvents table in the advanced hunting section of the Microsoft Defender XDR. For example, a simple query such as the one below can report all the events that have attack surface reduction rules as data source, for the last 30 days, and will summarize them by the ActionType count, that in this case it is the actual codename of the attack surface reduction rule.
DeviceEvents
| where Timestamp > ago(30d)
| where ActionType startswith "Asr"
| summarize EventCount=count() by ActionType
With advanced hunting you can shape the queries to your liking, so that you can see what is happening, regardless of whether you want to pinpoint something on an individual machine, or you want to extract insights from your entire environment.
Microsoft Defender for Endpoint machine timeline
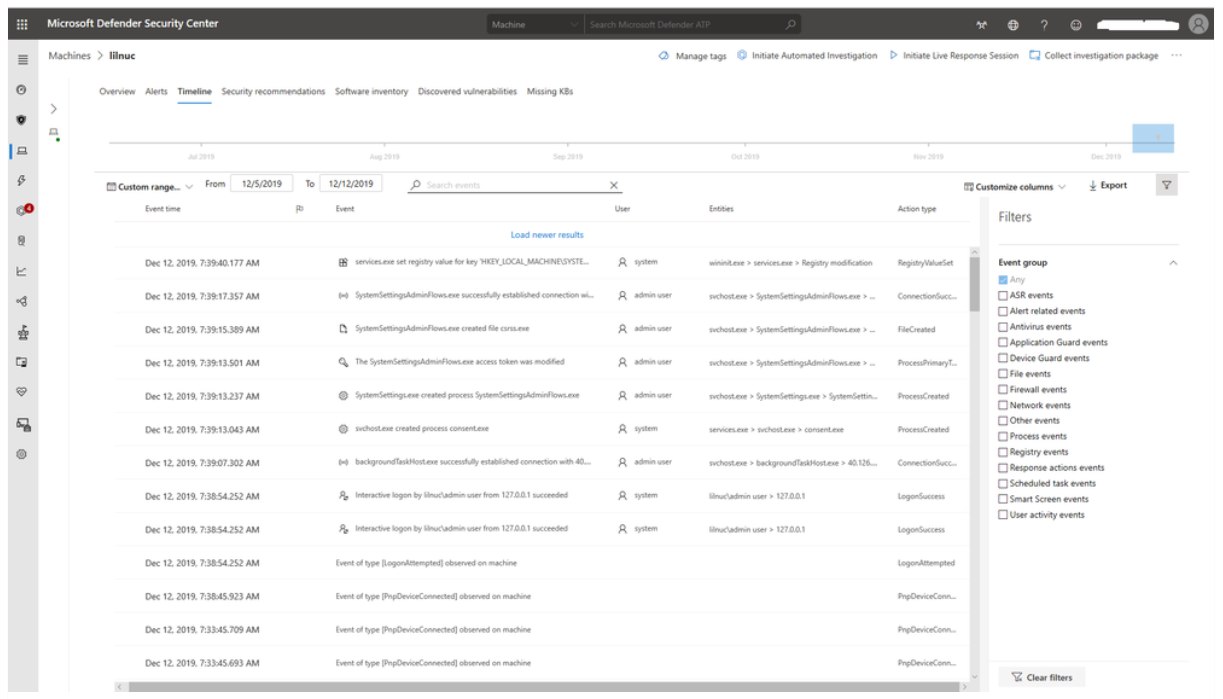
An alternative to advanced hunting, but with a narrower scope, is the Microsoft Defender for Endpoint machine timeline. You can view all the collected events of a device, for the past six months, in the Microsoft Defender XDR, by going to the Machines list, select a given machine, and then select on the Timeline tab.
The following screenshot shows the Timeline view of these events on a given endpoint. From this view, you can filter the events list based on any of the Event Groups along the right-side pane. You can also enable or disable Flagged and Verbose events while viewing alerts and scrolling through the historical timeline.
How to troubleshoot attack surface reduction rules?
The first and most immediate way is to check locally, on a Windows device, which attack surface reduction rules are enabled (and their configuration) is by using the PowerShell cmdlets.
Here are a few other sources of information that Windows offers, to troubleshoot attack surface reduction rules' impact and operation.
Querying which rules are active
One of the easiest ways to determine if attack surface reduction rules are already enabled is through a PowerShell cmdlet, Get-MpPreference.
Here's an example:
There are multiple attack surface reduction rules active, with different configured actions.
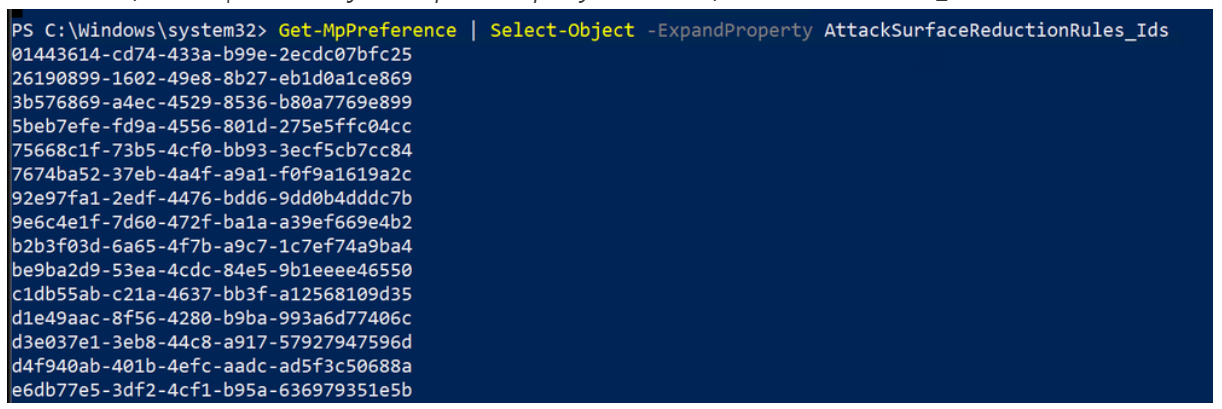
To expand the above information on attack surface reduction rules, you can use the properties AttackSurfaceReductionRules_Ids and/or AttackSurfaceReductionRules_Actions.
Example:
Get-MPPreference | Select-Object -ExpandProperty AttackSurfaceReductionRules_Ids
The above shows all the IDs for attack surface reduction rules that have a setting different from 0 (Not Configured).
The next step is then to list the actual actions (Block or Audit) that each rule is configured with.
Get-MPPreference | Select-Object -ExpandProperty AttackSurfaceReductionRules_Actions
Querying blocking and auditing events
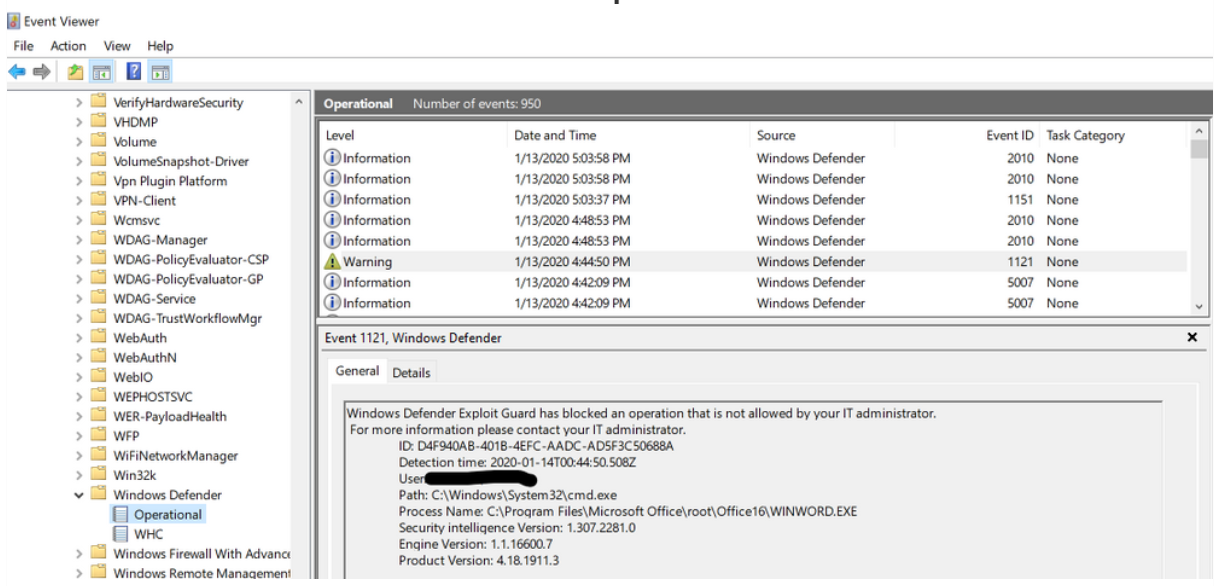
attack surface reduction rule events can be viewed within the Windows Defender log.
To access it, open Windows Event Viewer, and browse to Applications and Services Logs > Microsoft > Windows > Windows Defender > Operational.
Microsoft Defender Antimalware Protection Logs
You can also view rule events through the Microsoft Defender Antivirus dedicated command-line tool, called *mpcmdrun.exe*, that can be used to manage and configure, and automate tasks if needed.
You can find this utility in %ProgramFiles%\Windows Defender\MpCmdRun.exe. You must run it from an elevated command prompt (that is, run as Admin).
To generate the support information, type MpCmdRun.exe -getfiles. After a while, several logs will be packaged into an archive (MpSupportFiles.cab) and made available in C:\ProgramData\Microsoft\Windows Defender\Support.
Extract that archive and you'll have many files available for troubleshooting purposes.
The most relevant files are as follows:
- MPOperationalEvents.txt: This file contains same level of information found in Event Viewer for Windows Defender's Operational log.
- MPRegistry.txt: In this file you can analyze all the current Windows Defender configurations, from the moment the support logs were captured.
- MPLog.txt: This log contains more verbose information about all the actions/operations of the Windows Defender.
Tip
Do you want to learn more? Engage with the Microsoft Security community in our Tech Community: Microsoft Defender for Endpoint Tech Community.
Feedback
Coming soon: Throughout 2024 we will be phasing out GitHub Issues as the feedback mechanism for content and replacing it with a new feedback system. For more information see: https://aka.ms/ContentUserFeedback.
Submit and view feedback for
