Create custom Microsoft Defender XDR reports using Microsoft Graph security API and Power BI
Applies to:
Empowering security professionals to visualize their data enables them to quickly recognize complex patterns, anomalies, and trends that might otherwise be lurking underneath the noise. With visualizations, SOC teams can rapidly identify threats, make informed decisions, and communicate insights effectively across the organization.
There are multiple ways to visualize Microsoft Defender security data:
- Navigating built-in reports in the Microsoft Defender portal.
- Using Microsoft Sentinel workbooks with prebuilt templates for every Defender product (requires integration with Microsoft Sentinel).
- Applying the render function in Advanced Hunting.
- Using Power BI to expand existing reporting capabilities.
In this article, we create a sample Security Operations Center (SOC) efficiency dashboard in Power BI using Microsoft Graph security API. We access it in user context, therefore user must have corresponding permissions to be able to view alerts and incidents data.
Note
Example below is based on our new MS Graph security API. Find out more at: Use the Microsoft Graph security API.
Importing data into Power BI
In this section, we go through the steps required to get Microsoft Defender XDR data into Power BI, using Alerts data as an example.
Open Microsoft Power BI Desktop.
Select Get Data > Blank Query.
Select Advanced Editor.
Paste in Query:
let
    Source = OData.Feed("https://graph.microsoft.com/v1.0/security/alerts_v2", null, [Implementation="2.0"])
in
    Source
Select Done.
When you're prompted for credentials, select Edit Credentials:
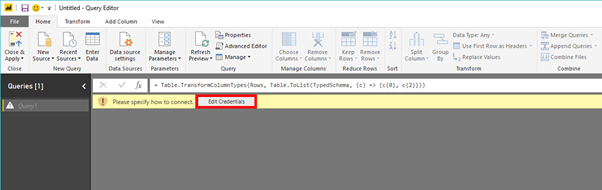
Select Organizational account > Sign in.
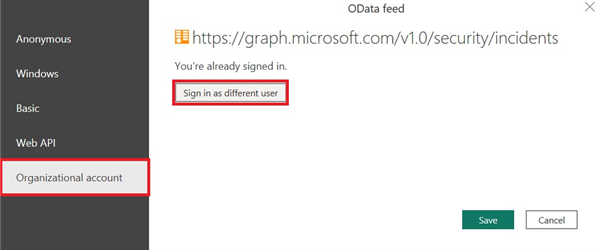
Enter credentials for account with access to Microsoft Defender XDR incidents data.
Select Connect.


Now the results of your query appear as a table, and you can start building visualizations on top of it.
Tip
If you are looking to visualize other forms of Microsoft Graph security data like Incidents, Advanced Hunting, Secure Score, etc., see Microsoft Graph security API Overview.
Filtering data
Microsoft Graph API supports OData protocol so that users don't have to worry about pagination - or requesting the next set of data. However, filtering data is essential to improving load times in a busy environment.
Microsoft Graph API supports query parameters. Here are few examples of filters used in the report:
The following query returns the list of alerts generated over the past three days. Using this query in environments with high volumes of data might result in hundreds of megabytes of data that could take a moment to load. By using this hardcoded approach, you're able to quickly see your most recent alerts over the last three days as soon as you open the report.
let
    AlertDays = "3",
    TIME = "" & Date.ToText(Date.AddDays(Date.From(DateTime.LocalNow()), -AlertDays), "yyyy-MM-dd") & "",
    Source = OData.Feed("https://graph.microsoft.com/v1.0/security/alerts_v2?$filter=createdDateTime ge " & TIME & "", null, [Implementation="2.0"])
in
    Source
Instead of collecting data across a date range, we can gather alerts across more precise dates by inputting a date using the YYYY-MM-DD format.
let
    StartDate = "YYYY-MM-DD",
    EndDate = "YYYY-MM-DD",
    Source = OData.Feed("https://graph.microsoft.com/v1.0/security/ alerts_v2?$filter=createdDateTime ge " & StartDate & " and createdDateTime lt " & EndDate & "", null, [Implementation="2.0"])
in
    Source
When historical data is required (for example, comparing the number of incidents per month), filtering by date isn't an option (since we want to go as far back as possible). In this case, we need to pull a few selected fields as shown in the following example:
let
    Source = OData.Feed("https://graph.microsoft.com/v1.0/security/alerts_v2?$filter=createdDateTime ge " & StartLookbackDate & " and createdDateTime lt " & EndLookbackDate &
"&$select=id,title,severity,createdDateTime", null, [Implementation="2.0"])
in
    Source
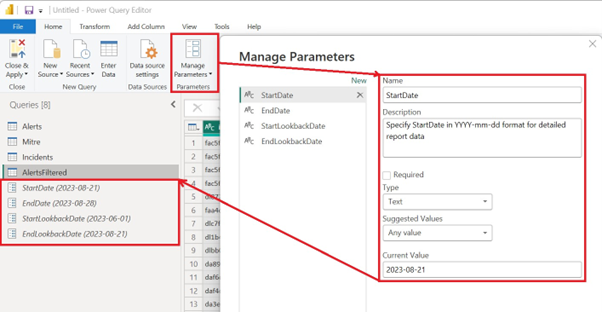
Introducing parameters
Instead of constantly querying the code to adjust the timeframe, use parameters to set a Start and End Date each time you open the report.
Go to Query Editor.
Select Manage Parameters > New Parameter.
Set desired parameters.
In the following example, we use two different time frames, Start and End dates.
Remove hardcoded values from the queries and make sure that StartDate and EndDate variable names correspond to parameter names:
let
    Source = OData.Feed("https://graph.microsoft.com/v1.0/security/incidents?$filter=createdDateTime ge " & StartDate & " and createdDateTime lt " & EndDate & "", null, [Implementation="2.0"])
in
    Source
Reviewing the report
Once the data has been queried and the parameters are set, now we can review the report. During the first launch of the PBIT report file, you're prompted to provide the parameters that we specified earlier:

The dashboard offers three tabs intended to provide SOC insights. The first tab provides a summary of all recent alerts (depending on the selected timeframe). This tab helps analysts clearly understand the security state over their environment using alert details broken down by detection source, severity, total number of alerts and mean-time-to-resolution.

The second tab offers more insight into the attack data collected across the incidents and alerts. This view can provide analysts with greater perspective into the types of attacks executed and how they map to the MITRE ATT&CK framework.

Power BI dashboard samples
For more information, see the Power BI report templates sample file.
Related articles
Feedback
Coming soon: Throughout 2024 we will be phasing out GitHub Issues as the feedback mechanism for content and replacing it with a new feedback system. For more information see: https://aka.ms/ContentUserFeedback.
Submit and view feedback for