Note
Access to this page requires authorization. You can try signing in or changing directories.
Access to this page requires authorization. You can try changing directories.
The Microsoft Defender portal applies correlation analytics and aggregates related alerts and automated investigations from different products into an incident. Microsoft Sentinel and Defender XDR also trigger unique alerts on activities that can only be identified as malicious given the end-to-end visibility in the unified platform across the entire suite of products. This view gives your security analysts the broader attack story, which helps them better understand and deal with complex threats across your organization.
Important
Microsoft Sentinel is generally available in the Microsoft Defender portal, with or without Microsoft Defender XDR or an E5 license. For more information, see Microsoft Sentinel in the Microsoft Defender portal.
Incident queue
The Incident queue shows a collection of incidents that were created across devices, users, mailboxes, and other resources. It helps you sort through incidents to prioritize and create an informed cybersecurity response decision, a process known as incident triage.
You can get to the incident queue from Incidents & alerts > Incidents on the quick launch of the Microsoft Defender portal. Here's an example.

Select Most recent incidents and alerts to toggle the expansion of the top section, which shows a timeline graph of the number of alerts received and incidents created in the last 24 hours.

Below that, the incident queue in the Microsoft Defender portal displays incidents seen in the last six months. You can choose a different time frame by selecting it from the drop-down at the top. Incidents are arranged according to the latest automatic or manual updates made to an incident. You can arrange the incidents by last update time column to view incidents according to the latest automatic or manual updates made. You can also find the total number of incidents in the queue indicated beside the Search bar. The total number of incidents varies depending on the filters used in the queue.
The incident queue has customizable columns that give you visibility into different characteristics of the incident or the impacted entities. This filtering helps you make an informed decision regarding the prioritization of incidents for analysis. Select Customize columns to perform the following customizations based on your preferred view:
- Check/uncheck the columns you want to see in the incident queue.
- Arrange the order of the columns by dragging them.

The Export feature allows you to export the data in the incident queue that is displayed according to the applied filters and time ranges. It's available in the form of a button named Export, as displayed in the following screenshot:
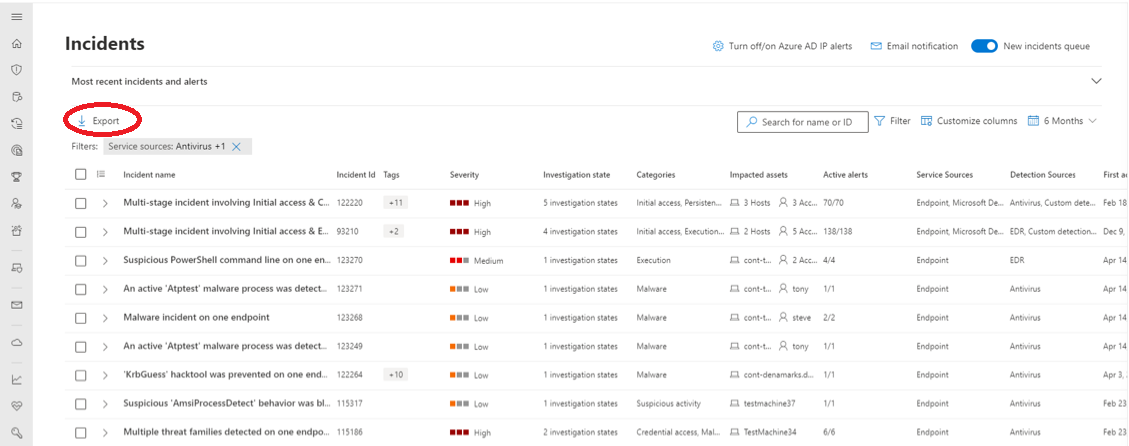
When you click the Export button, the data is exported to a CSV file. You can apply various filters and time ranges to the incidents queue (not just in the context of exporting the data, but in a generic context). When you select Export, whichever filters and/or time ranges are applied to the incidents queue, such data is exported to the CSV file.
Once you export the incidents queue-related data onto the CSV file, you can analyze the data and filter it further, based on your requirements.
Note
The maximum number of records you can export to a CSV file is 10,000.
Incident names
For more visibility at a glance, Microsoft Defender XDR generates incident names automatically, based on alert attributes such as the number of endpoints affected, users affected, detection sources, or categories. This specific naming allows you to quickly understand the scope of the incident.
For example: Multi-stage incident on multiple endpoints reported by multiple sources.
If you onboarded Microsoft Sentinel to the Defender portal, then any alerts and incidents coming from Microsoft Sentinel are likely to have their names changed (regardless of whether they were created before or since the onboarding).
We recommend that you avoid using the incident name as a condition for triggering automation rules. If the incident name is a condition, and the incident name changes, the rule will not be triggered.
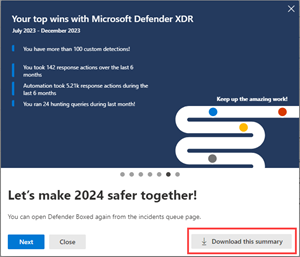
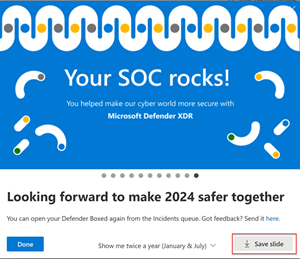
Defender Boxed
For a limited time during January and July of each year, Defender Boxed automatically appears when you first open the incident queue. Defender Boxed highlights your organization's security success, improvements, and response actions during the previous six months or calendar year.
Note
Defender Boxed is only available to users who performed applicable activities in the Microsoft Defender portal.
You can do the following actions in the series of cards that appear in Defender Boxed:
Download a detailed summary of your achievements that can be shared with others in your organization.
Change the frequency of how often Defender Boxed will appear. You can choose between once (every January) or twice (every January and July) per year.
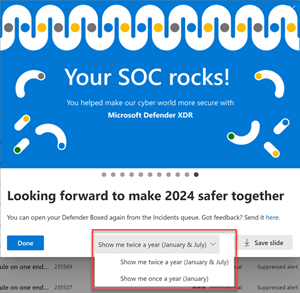
Share your achievement to your social media networks, email, and other forums by saving the slide as an image.


To reopen Defender Boxed, go to the Incidents queue and then select Your Defender Boxed on the right side of the pane.

Filters
The incident queue also provides multiple filtering options, that when applied, enable you to perform a broad sweep of all existing incidents in your environment, or decide to focus on a specific scenario or threat. Applying filters on the incident queue can help determine which incident requires immediate attention.
The Filters list above the list of incidents shows the currently applied filters.
From the default incident queue, you can select Add filter to see the Add filter drop-down, from which you specify filters to apply to the incidents queue to limit the set of incidents shown. Here's an example.
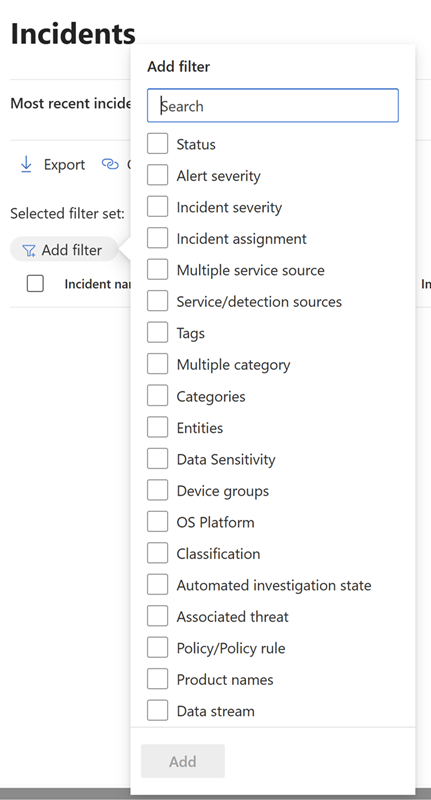
Select the filters you want to use, then select Add at the bottom of the list to make them available.
Now the filters you selected are shown along with the existing applied filters. Select the new filter to specify its conditions. For example, if you chose the "Service/detection sources" filter, select it to choose the sources by which to filter the list.
You can also see the Filter pane by selecting any of the filters in the Filters list above the list of incidents.
This table lists the filter names that are available.
| Filter name | Description/Conditions |
|---|---|
| Status | Select New, In progress, or Resolved. |
| Alert severity Incident severity |
The severity of an alert or incident is indicative of the impact it can have on your assets. The higher the severity, the bigger the impact and typically requires the most immediate attention. Select High, Medium, Low, or Informational. |
| Incident assignment | Select the assigned user or users. |
| Multiple service sources | Specify whether the filter is for more than one service source. |
| Service/detection sources | Specify incidents that contain alerts from one or more of the following: Many of these services can be expanded in the menu to reveal further choices of detection sources within a given service. |
| Tags | Select one or multiple tag names from the list. |
| Multiple category | Specify whether the filter is for more than one category. |
| Categories | Choose categories to focus on specific tactics, techniques, or attack components seen. |
| Entities | Specify the name of an asset such as a user, device, mailbox, or application name. |
| Data sensitivity | Some attacks focus on targeting to exfiltrate sensitive or valuable data. By applying a filter for specific sensitivity labels, you can quickly determine if sensitive information has potentially been compromised and prioritize addressing those incidents. This filter displays information only when you've applied sensitivity labels from Microsoft Purview Information Protection. |
| Device groups | Specify a device group name. |
| OS platform | Specify device operating systems. |
| Classification | Specify the set of classifications of the related alerts. |
| Automated investigation state | Specify the status of automated investigation. |
| Associated threat | Specify a named threat. |
| Policy/policy rule | Filter incidents based on policy or policy rule. |
| Product names | Filter incidents based on product name. |
| Data stream | Filter incidents based on the location or workload. |
Note
If you have provisioned access to Microsoft Purview Insider Risk Management, you can view and manage insider risk management alerts and hunt for insider risk management events in the Microsoft Defender portal. For more information, see Investigate insider risk threats in the Microsoft Defender portal.
The default filter is to show all alerts and incidents with a status of New and In progress and with a severity of High, Medium, or Low.
You can quickly remove a filter by selecting the X in the name of a filter in the Filters list.
You can also create filter sets within the incidents page by selecting Saved filter queries > Create filter set. If no filter sets have been created, select Save to create one.

Note
Microsoft Defender XDR customers can now filter incidents with alerts where a compromised device communicated with operational technology (OT) devices connected to the enterprise network through the device discovery integration of Microsoft Defender for IoT and Microsoft Defender for Endpoint. To filter these incidents, select Any in the Service/detection sources, then select Microsoft Defender for IoT in the Product name or see Investigate incidents and alerts in Microsoft Defender for IoT in the Defender portal. You can also use device groups to filter for site-specific alerts. For more information about Defender for IoT prerequisites, see Get started with enterprise IoT monitoring in Microsoft Defender XDR.
Save custom filters as URLs
Once you've configured a useful filter in the incidents queue, you can bookmark the URL of the browser tab or otherwise save it as a link on a Web page, a Word document, or a place of your choice. Bookmarking gives you single-click access to key views of the incident queue, such as:
- New incidents
- High-severity incidents
- Unassigned incidents
- High-severity, unassigned incidents
- Incidents assigned to me
- Incidents assigned to me and for Microsoft Defender for Endpoint
- Incidents with a specific tag or tags
- Incidents with a specific threat category
- Incidents with a specific associated threat
- Incidents with a specific actor
Once you have compiled and stored your list of useful filter views as URLs, use it to quickly process and prioritize the incidents in your queue and manage them for subsequent assignment and analysis.
Search
From the Search for name or ID box above the list of incidents, you can search for incidents in a number of ways, to quickly find what you're looking for.
Search by incident name or ID
Search directly for an incident by typing the incident ID or the incident name. When you select an incident from the list of search results, the Microsoft Defender portal opens a new tab with the properties of the incident, from which you can start your investigation.
Search by impacted assets
You can name an asset—such as a user, device, mailbox, application name, or cloud resource—and find all the incidents related to that asset.
Specify a time range
The default list of incidents is for those that occurred in the last six months. You can specify a new time range from the drop-down box next to the calendar icon by selecting:
- One day
- Three days
- One week
- 30 days
- 30 days
- Six months
- A custom range in which you can specify both dates and times
Next steps
After you've determined which incident requires the highest priority, select it and:
- Manage the properties of the incident for tags, assignment, immediate resolution for false positive incidents, and comments.
- Begin your investigations.
See also
Tip
Do you want to learn more? Engage with the Microsoft Security community in our Tech Community: Microsoft Defender XDR Tech Community.