Note
Access to this page requires authorization. You can try signing in or changing directories.
Access to this page requires authorization. You can try changing directories.
At a glance
Goal: View requests in Chrome DevTools
Time: 5 minutes
Plugins: DevToolsPlugin
Prerequisites: Set up Dev Proxy
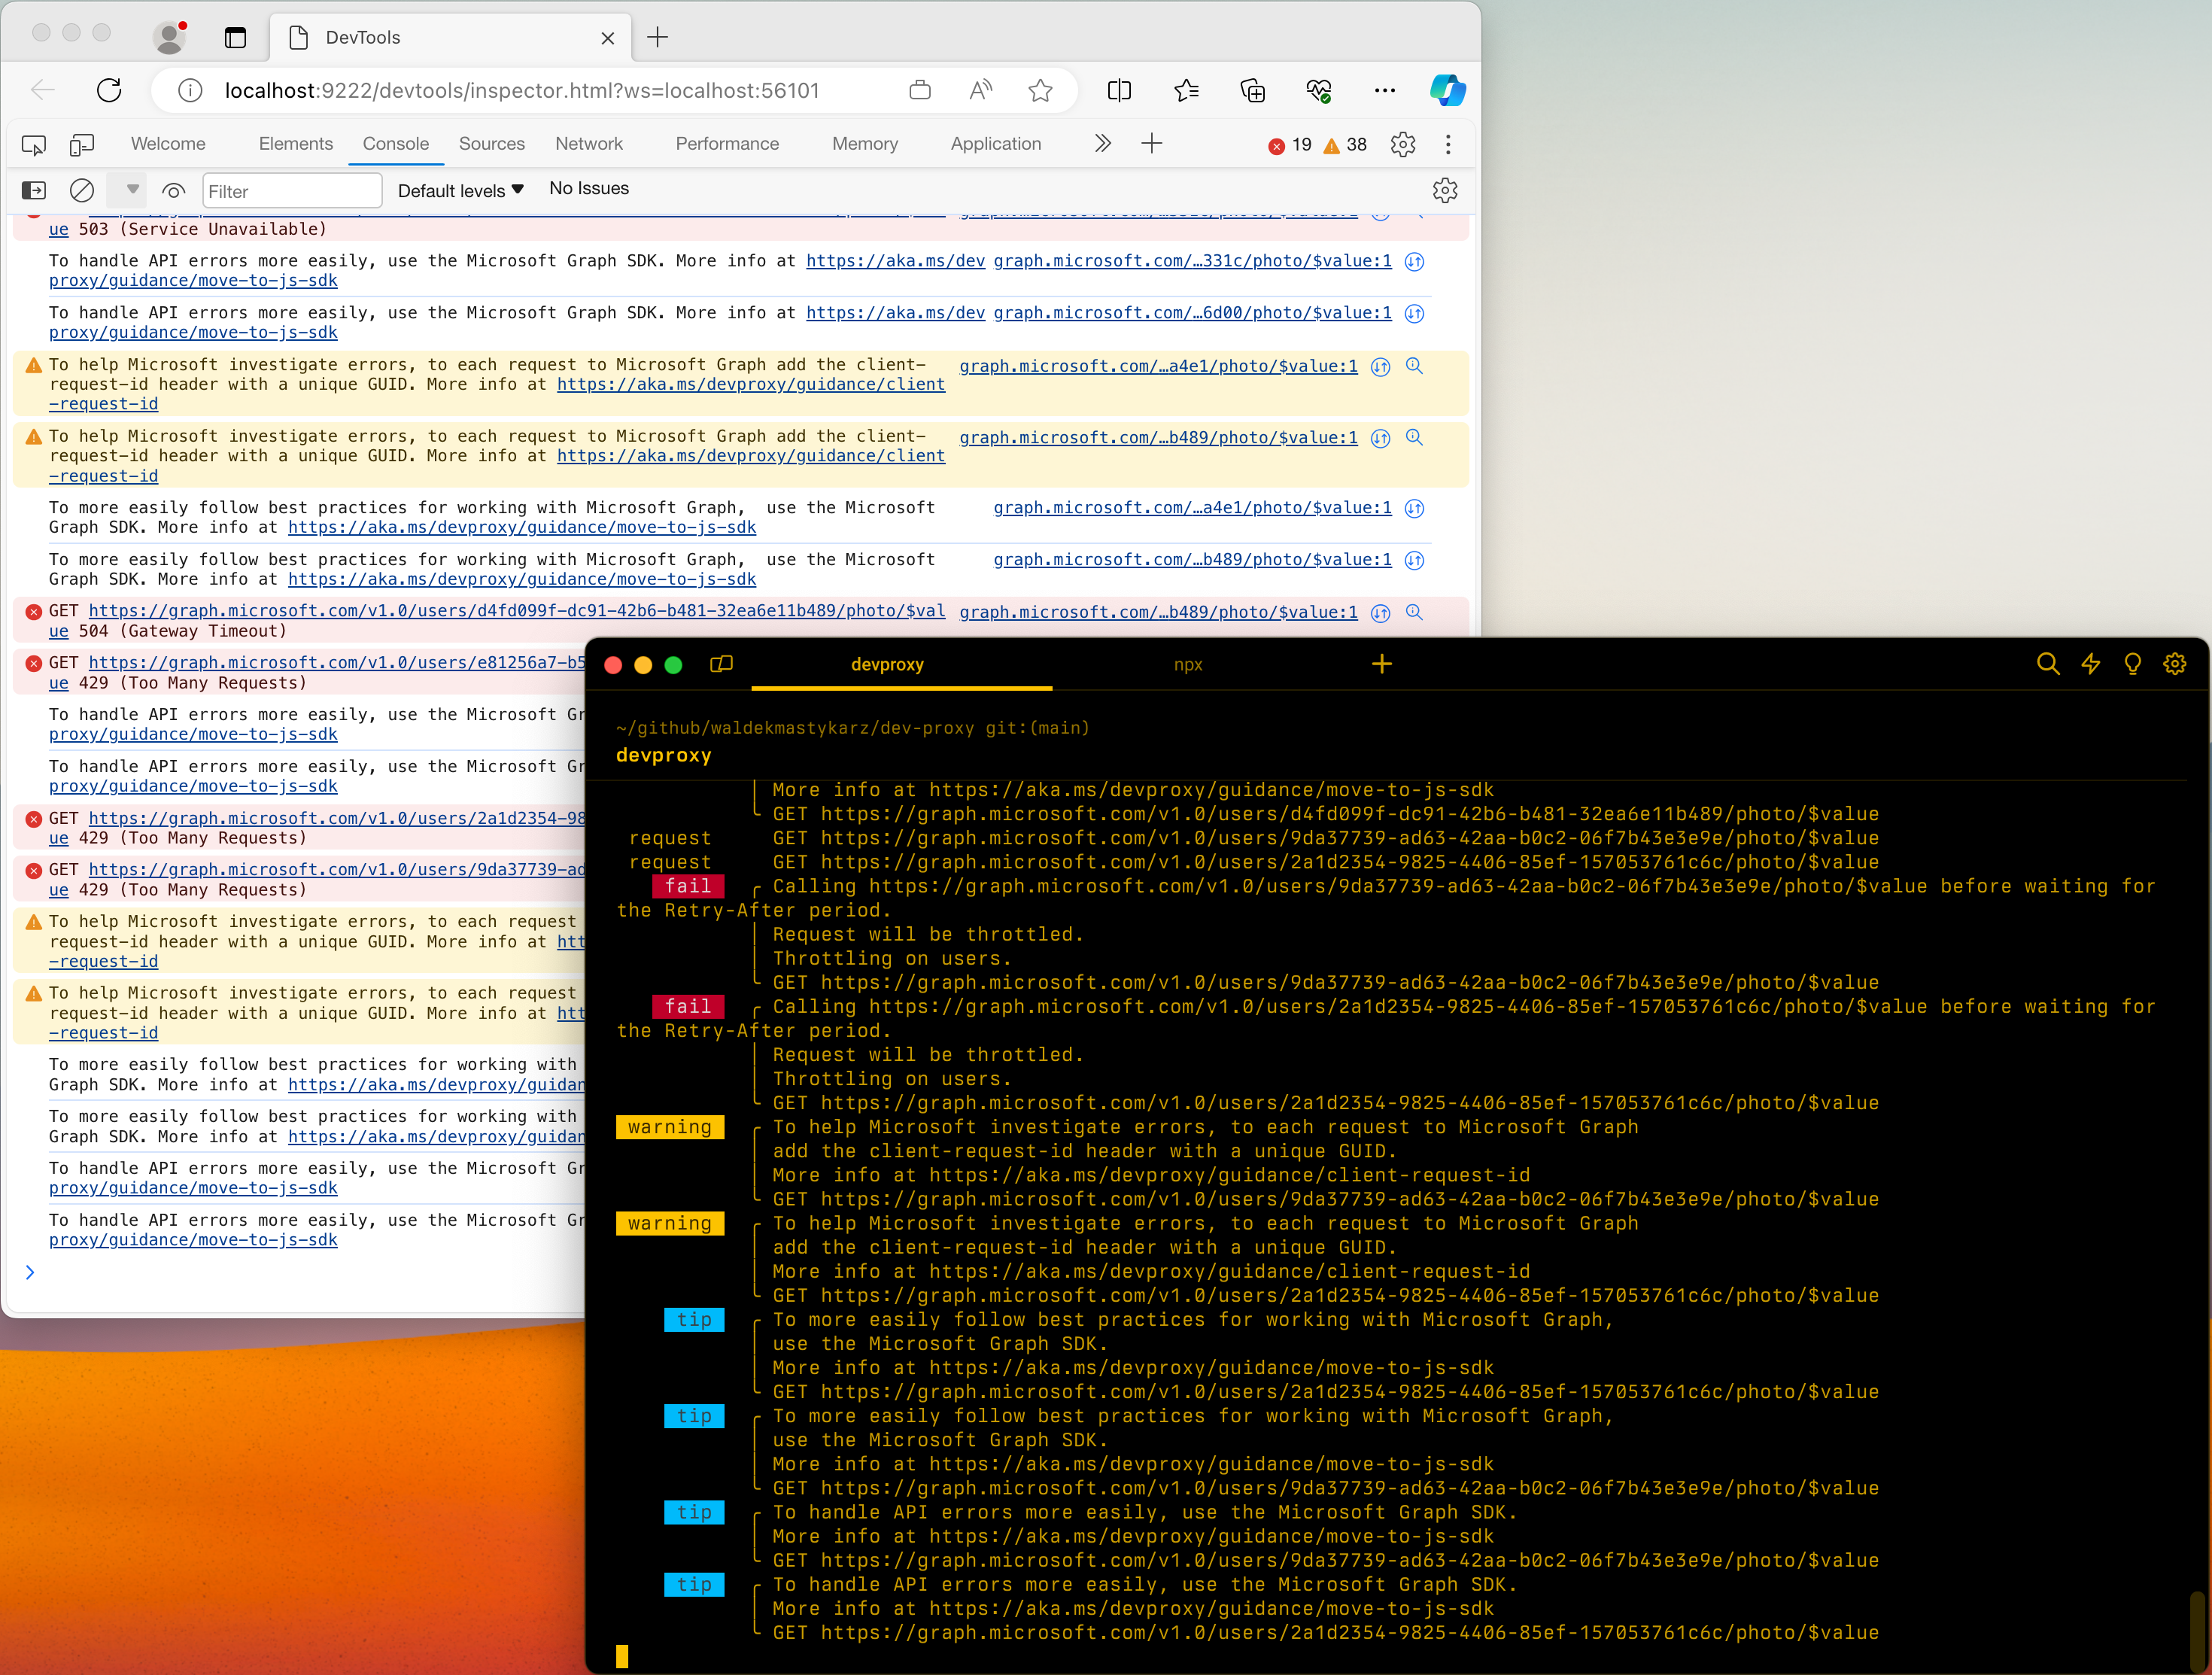
By default, Dev Proxy displays its messages in the command prompt. If you use Dev Proxy with an application that issues many requests, it's difficult to find the messages you're interested in. What's more, you might want to inspect the requests and responses intercepted by Dev Proxy.
To make it easier to find the messages you're interested in, use the DevToolsPlugin plugin to display Dev Proxy messages in Chrome DevTools.
Tip
Dev Proxy supports using Chrome DevTools with Microsoft Edge, Microsoft Edge Dev and Google Chrome.
The DevToolsPlugin exposes Dev Proxy messages, and information about intercepted requests and responses in Chrome DevTools.
To use Chrome DevTools with Dev Proxy:
Open the devproxyrc.json file stored in your Dev Proxy installation directory. You can also use the
devproxy config opencommand.Enable the
DevToolsPluginplugin and add thedevToolsconfiguration section. SupportedpreferredBrowservalues are:Edge,EdgeDev,Chrome.The complete
devproxyrc.jsonfile looks like:File: devproxyrc.json
{
  "$schema": "https://raw.githubusercontent.com/dotnet/dev-proxy/main/schemas/v2.4.0/rc.schema.json",
  "plugins": [
    {
      "name": "DevToolsPlugin",
      "enabled": true,
      "pluginPath": "~appFolder/plugins/DevProxy.Plugins.dll",
      "configSection": "devTools"
    }
  ],
  "devTools": {
    "$schema": "https://raw.githubusercontent.com/dotnet/dev-proxy/main/schemas/v2.4.0/devtoolsplugin.schema.json",
    "preferredBrowser": "Edge"
  }
}
Save the
devproxyrc.jsonfile and start Dev Proxy.

