Note
Access to this page requires authorization. You can try signing in or changing directories.
Access to this page requires authorization. You can try changing directories.
The Analytics page in Copilot Studio provides consumption data on the billed Copilot Credits or sessions your agent uses.
If your billing is based on Copilot Credits consumption, these analytics show how many Copilot Credits your agent consumes and what activity counts toward Copilot Credits consumption over a time period.
If your billing is based on session consumption (available for licenses purchased before January 1, 2024), these analytics show how many billed sessions your agent consumes over a given time period.
Copilot Credits consumption
Copilot Credits are the unit that measures agent usage. The total cost is calculated based on the sum of the Copilot Credits used by your organization. The number of Copilot Credits consumed by an agent depends on the design of the agent, how often customers interact with it, and the features they use.
Note
If your organization uses an older subscription plan that uses billed sessions instead of Copilot Credits, the Analytics page shows the number of billed sessions. If your organization switches from billed sessions to Copilot Credits during the time period you're analyzing, data on both billed sessions and Copilot Credits appear.
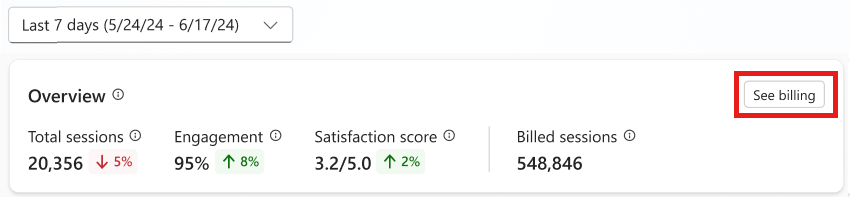
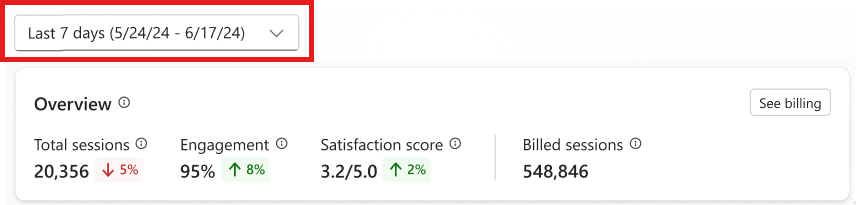
On the Analytics page for your agent, the Overview panel shows your agent's total billed Copilot Credits for the selected time period. To change the time period, select the time period dropdown at the top of the Analytics page. To view more details about the billing information, select See billing.

The analytics data takes a few hours to update with new billed Copilot Credits, so you might not see data about recent activity.
Billing trend
The Billing trend chart shows the changes in your agent's billed Copilot Credits over the selected time period.
Hover over points in the chart to see the number of Copilot Credits.

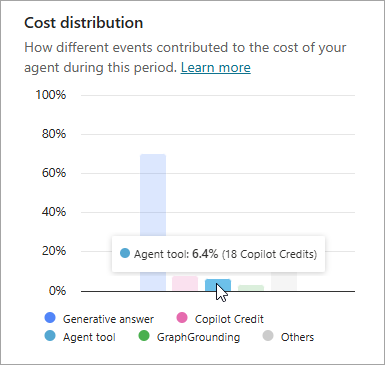
Cost distribution
The Cost distribution chart shows which kinds of activity count towards Copilot Credits usage. The chart uses the total number of Copilot Credits for each activity, and each activity can consume different numbers of Copilot Credits per occurrence. For more information on how different activities consume Copilot Credits, see Billing rates and management.
Hover over columns in the chart to see the number of Copilot Credits.
Monthly Credit limit
The Monthly Credit limit visualizes as a stacked bar chart how many Copilot Credits were consumed ("used") in the calendar month and how many remain. Use this section to determine if your agent is within, near, or exceeding budgeted limits. Hover over bar segments to see the number of Copilot Credits Used and Remaining.


Session consumption
A billed session is an interaction between a customer and an agent. It represents one unit of consumption. Use the Analytics page to view how many sessions your agent consumed during the configured time period. Billed sessions are different from conversational or event trigger sessions, and are calculated differently.
If your organization switches from billed sessions to Copilot Credits during the time period you're analyzing, data for both billed sessions and Copilot Credits appear.
Note
This section is for billed sessions in the legacy Power Virtual Agents license, which was available for purchase starting on December 1, 2023. This legacy license is no longer available for purchase as of January 1, 2024.
On the Analytics page for your agent, the Overview panel shows your agent's total billed sessions for the selected time period. To see more details, select See billing.
To change the time period, select the time period dropdown at the top of the Analytics page.
The analytics data takes a few hours to update with new billed session counts, so you might not see data about recent activity.
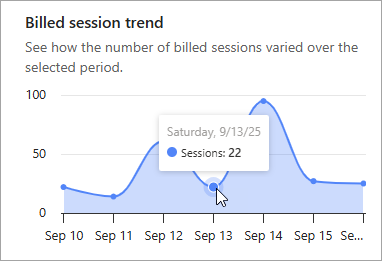
Billed session trend
The Billed session trend chart shows the changes in billed sessions over the selected time period.
Hover over points in the chart to see exact session counts.