Note
Access to this page requires authorization. You can try signing in or changing directories.
Access to this page requires authorization. You can try changing directories.
Agent Insights Hub is an analytics and monitoring dashboard for Microsoft Copilot Studio agents. It provides visibility into agent performance, conversation metrics, topic analytics, tool execution, error tracking, and Copilot credit consumption from a single experience in the Copilot Agent Kit app.
Agent Insights Hub aggregates telemetry from three data sources into a set of Dataverse tables that power its tabs and dashboards.
| Data source | Tabs powered | What it captures |
|---|---|---|
| Azure Application Insights | Overview, Daily metrics, Topics, Tools, Actions, Errors | Telemetry logs from agent conversations: response times, topic triggers, tool calls, and errors. |
| Conversation Transcripts | Transcripts | Session-level data from Copilot Studio: engagement, resolution, escalation, CSAT, and feedback. |
| Power Platform admin center | Usage history | Copilot credit consumption: billed and nonbilled credits by agent, environment, and feature. |
Prerequisites
Before you use Agent Insights Hub, make sure the following prerequisites are met:
- The Agent Inventory sync runs at least once so that agent details are available for selection. Learn more in Monitor agents using Agent Inventory in Copilot Agent Kit.
- Your Copilot Studio agents connect to an Azure Application Insights resource. Learn more in Enable Application Insights support in Copilot Studio.
- A Microsoft Entra ID app is registered with access to the Application Insights telemetry data. Learn more in Enable Application Insights support in Copilot Studio.
- The signed-in user is assigned the CSK - Administrator security role.
- The Copilot Agent Kit code app is shared with the users who need access. The owner of the code app (or the system administrator who installed the kit) must share the app with the team. Learn more in Share a canvas app with your organization.
Set up Agent Insights Hub
Complete the following steps to set up Agent Insights Hub.
Integrate Copilot Studio with Application Insights
To collect telemetry from your Copilot Studio agents, connect them to Azure Application Insights:
- Open Copilot Studio and select your agent.
- Select Settings, select Advanced, and then select Application Insights.
- Enter your Application Insights connection string. You can find it in the Azure portal under Application Insights > Overview > Connection string.
- Select Save.
Learn more in Connect your copilot to Application Insights.
Register a Microsoft Entra ID app for Application Insights access
The sync flow needs programmatic access to query Application Insights telemetry. This access requires a Microsoft Entra ID app registration with the appropriate permissions.
Learn more in Enable Application Insights support in Copilot Studio. The article covers:
- Creating a Microsoft Entra ID app registration.
- Granting the app access to your Application Insights resource.
- Obtaining the Application ID, Tenant ID, Client ID, and client secret.
- Configuring secret storage. Dataverse is currently supported; Azure Key Vault support is planned for a future release.
Run Agent Inventory sync
Before you add agents to Agent Insights Hub, make sure that the Agent Inventory sync runs at least once. The sync populates the agent list that appears in the Add agent panel. Learn more in Monitor agents using Agent Inventory in Copilot Agent Kit.
Add an agent configuration
Open Agent Insights Hub.
Select Add agent.
Enter the following information:
Field Description Agent Select an agent from the inventory. This selection autofills Name, Agent Name, Agent ID, and Dataverse URL. Name A friendly display name for the configuration. The name must be unique. Agent Name The name of the Copilot Studio agent. Autofilled when an agent is selected. Agent ID The unique identifier (GUID) of the Copilot Studio agent. You can find this value in Copilot Studio under Settings > Session details. Dataverse URL The base URL of the Dataverse environment, for example https://org.crm.dynamics.com.Application Insights App ID The Application ID from your Azure Application Insights resource. You can find this value in the Azure portal under Application Insights > API Access. Tenant ID The Microsoft Entra ID tenant ID where the Application Insights resource is registered. Client ID The client ID of the Microsoft Entra ID app registration used to authenticate with Application Insights. Secret Location Currently supports Dataverse storage only. Azure Key Vault support is planned for a future release. Secret The client secret for the Microsoft Entra ID app registration. KPI Source Select which data sources to use: Application Insights, Conversation Transcripts, or Usage History. Select one, two, or all three based on your needs. Capture User Details When enabled, user identity information (the user name that interacted with the agent) is captured from telemetry logs. Capture User Feedback When enabled, end-user satisfaction feedback is collected. Select Save.
Run your first sync
After you add an agent configuration:
- Select Sync.
- In Generate Metrics, select a configuration (or All Agents to sync all at once), and set the Start Date and End Date for historical data extraction. You can go up to 365 days back.
- Select Run.
The sync triggers a cloud flow that queries Application Insights for telemetry data, fetches conversation transcripts from Copilot Studio, processes and aggregates the data into KPI records, and writes the results to Dataverse tables. You can monitor progress in the Sync Logs tab.
How it works
Agent Insights Hub supports two sync modes:
| Mode | Trigger | Data range | Use case |
|---|---|---|---|
| Scheduled | Runs automatically every day | Last 24 hours | Keeps metrics up to date with daily incremental syncs. |
| On-demand | User selects Sync | Custom start and end date (up to 365 days) | Backfill historical data or resync a specific date range. |
Both modes pull telemetry from Application Insights and conversation transcripts from Copilot Studio for the selected period. The data is processed and aggregated, then written to a set of Dataverse tables: Daily Metrics, Topic Metrics, Tool Metrics, Action Metrics, Error Details, and Transcript Metrics. Agent Insights Hub reads from those tables to render each tab.
Use Agent Insights Hub
The following sections describe the actions, filters, and tabs available in Agent Insights Hub.
Action buttons
These buttons appear on the Overview section header and in empty state screens.
| Button | Description |
|---|---|
| Sync | Opens the Generate Metrics panel to trigger a historical data sync for one or all agents. Select a date range (up to 365 days) and select Run. |
| Add agent | Opens the Add agent panel to create a new agent configuration with Application Insights credentials and KPI source selection. |
| Show agents | Opens a panel that lists all configured agents with their details, KPI sources, and status. You can edit, clone, and delete configurations. |
Filters
A global filter bar appears on all tabs except Sync Logs, Transcripts Staging, and Usage History (which has its own filters).
| Filter | Options | Default | Description |
|---|---|---|---|
| Agent | All agents, or a specific configured agent | All agents | Filters data to a specific agent configuration. |
| Date Range | Last 7, 30, 90, 180, or 365 days, or Custom range | Last 90 days | Controls the time period for all metrics. Custom range shows start and end date pickers. |
| Channel | All channels, Teams, Web Chat, Direct Line, Test Panel, Autonomous, Published Engine, Mobile, WhatsApp, Unknown | All channels | Filters by the communication channel used for conversations. |
| Data Mode | Production, Test data, All data | Production | Filters by data source type. Production shows real user data; Test data shows test pane interactions. |
The Usage History tab has its own independent filters:
| Filter | Description |
|---|---|
| Environment | Filter by Power Platform environment. |
| Agent | Filter by agent (derived from usage data, not configurations). |
| Date | Month to date, previous months, or last 6 months. |
| Feature | Filter by Copilot feature name. |
Overview tab
Data source: Application Insights telemetry (Daily Metrics, Topic Metrics, Tool Metrics, and Error Details tables).
The Overview tab provides a high-level summary of agent performance. It displays seven KPI cards with trend indicators that compare the current period against the previous period of equal length.
| KPI | Calculation | Display | Trend |
|---|---|---|---|
| Conversations | Sum of Daily Conversation Count across all days | Number | Higher is better |
| Average DAU | Sum of Daily Unique Users / Number of distinct days in the period | Number (rounded) | Higher is better |
| Responses | Sum of Total Responses (bot messages sent) | Number | Higher is better |
| Average response | Sum of Total Response Time (ms) / Sum of Total Responses | Seconds (if >= 1s) or ms | Lower is better (inverted trend) |
| Duration | Sum of Total Duration (ms) / Sum of Conversations With Duration Data / 60,000 | Minutes (1 decimal) | Lower is better (inverted trend) |
| Tool success | (Sum of Tool Success Count / Sum of Tool Call Count) x 100 | Percentage | Higher is better |
| Errors | Sum of Error Count | Number | Lower is better (inverted trend) |
Trends compare the current period value against the previous period of equal length. For example, when you view the last 30 days, the trend compares against the 30 days before that. When the previous period has no data but the current period does, the trend shows New instead of a percentage.
The Overview tab also includes the following charts:
| Chart | Type | Description |
|---|---|---|
| Top topics | Donut | Top 10 topics ranked by trigger count. |
| Slowest topics (min) | Horizontal bar | Top 5 topics by weighted average duration (Total Duration / Duration Count per topic). |
| Conversations by channel | Donut | Distribution of conversations across channels (Teams, Web Chat, and others). |
| Single vs Multi-turn sessions | Donut | Single-turn conversations (one user message) vs. multi-turn (two or more messages). |
| Session duration distribution | Donut | Short (less than 1 min), Medium (1-10 min), Long (more than 10 min). |
| Error distribution by type | Donut | Top 10 errors by error code. |
| Top tools | Donut | Top 10 tools by call volume. |
| Slowest tools | Horizontal bar | Top 5 tools by weighted average response time. |
| Response time (s) | Grouped bar | Daily average and P90 response times. |
| Unique users (n) | Interactive tags | Unique users from Application Insights telemetry logs. Anonymous users are filtered out. |
Daily Metrics tab
Data source: Application Insights telemetry (Daily Metrics table).
The Daily Metrics tab shows daily aggregated conversation metrics with time-series charts and a detailed data table.
| Chart | Type | Description |
|---|---|---|
| Daily Conversation Volume | Area (full width) | Daily distinct conversation count. Shows engagement trends and peak usage. |
| Daily Active Users | Area (half width) | Daily unique users. Requires user capture enabled in the agent configuration. |
| Daily Messages | Area (half width) | User messages and bot responses sent per day. |
The Daily Metrics data table contains all daily metric fields, including conversation counts, unique users, tools, and topics, message counts, response time percentiles (P10, P50, P90, P95, or P99), duration metrics, conversation type breakdown (single-turn or multi-turn, short, medium, or long), tool stats, and error counts.
Topics tab
Data source: Application Insights telemetry (Topic Metrics table).
The Topics tab analyzes topic performance, including which topics users trigger most, completion rates, and where errors occur.
| KPI | Calculation | Description |
|---|---|---|
| Total Triggers | Sum of Trigger Count | Total times topics were triggered (TopicStart events). |
| Completed | Sum of Completion Count | Topics that ran to completion (TopicEnd events). |
| Abandoned | Sum of Abandonment Count | Topics where triggers exceeded completions and redirects. |
| Avg Duration | Sum of Total Duration (ms) / Sum of Duration Count | Average time from TopicStart to TopicEnd, displayed as human-readable duration. |
| Errors | Sum of Error Count | Errors attributed to topics based on the most recent active topic. |
| Messages | Sum of Message Count | Total user messages (text only) attributed to topics. |
The Topics tab includes the following charts:
| Chart | Type | Description |
|---|---|---|
| Topic Triggers Over Time | Area | Daily trend of topic triggers. |
| Topics with Most Errors | Horizontal bar | Top 5 topics by error count. Shown only when errors exist. |
| Top Topics by Triggers | Donut | Top 10 most frequently triggered topics. |
| Messages In vs Out | Donut | User messages vs. bot responses attributed to topics. |
The Topic Metrics data table contains all topic-level metrics, including trigger counts, completion counts, completion rate, redirect counts, and abandonment counts.
Tools tab
Data source: Application Insights telemetry (Tool Metrics table).
The Tools tab monitors the reliability and speed of external dependencies (HTTP requests, connectors, flows, generative AI calls) that agents invoke during conversations.
| KPI | Calculation | Description |
|---|---|---|
| Total Calls | Sum of Call Count | Total external dependency calls. |
| Unique Tools | Count of distinct Tool Name values | Number of different tools called. |
| Success Rate | (Sum of Success Count / Sum of Call Count) x 100 | Percentage of successful tool calls. |
| Total Failures | Sum of Failure Count | Number of failed tool calls. |
| Avg Response Time | Weighted average of Avg Response Time (ms), weighted by Call Count per record | Average tool response time, displayed in ms or seconds. |
| P90 Response Time | Weighted average of P90 Response Time (ms), weighted by Call Count per record | 90th percentile. 90% of calls were faster than this value. |
The Tools tab includes the following charts:
| Chart | Type | Description |
|---|---|---|
| Tool Calls Over Time | Area | Daily trend of tool invocations. |
| Tool Type Distribution | Donut | Distribution by tool type (Action, Connector, and others). |
| Tool Failures Over Time | Area | Daily trend of failures. Spikes indicate reliability issues. |
| Tool success rate (%) | Horizontal bar | Top 10 tools ranked by success percentage. |
The Tool Metrics data table contains all tool-level metrics, including call counts, success counts, failure counts, and success rate.
Actions tab
Data source: Application Insights telemetry (Action Metrics table).
The Actions tab tracks how action nodes perform, including execution volume, speed, and the types of actions being used (HTTP requests, flow invocations, connector actions, and others).
| KPI | Calculation | Description |
|---|---|---|
| Total Executions | Sum of Execution Count | Total action node executions. |
| Unique Actions | Count of distinct Node Kind values | Number of different action types (HTTP, Flow, Connector, and others). |
| Avg Elapsed Time | Sum of Total Elapsed (ms) / Sum of Execution Count | Average time per action execution, displayed in ms or seconds. |
The Actions tab includes the following charts:
| Chart | Type | Description |
|---|---|---|
| Execution Trend | Area | Daily count of action executions over time. |
| Node Kind Distribution | Donut | Breakdown by action type. Shows most used types. |
The Action Metrics data table contains all action-level metrics, including execution counts and elapsed times.
Errors tab
Data source: Application Insights telemetry (Error Details table).
The Errors tab shows which errors occur most often, how many users are affected, and how errors change over time.
| KPI | Calculation | Description |
|---|---|---|
| Total Errors | Sum of Error Count | Total OnErrorLog events recorded. |
| Unique Error Codes | Count of distinct Error Code values | Number of different error types encountered. |
| Affected Conversations | Sum of Daily Affected Conversations | Conversations that experienced errors. This count might include duplicates across days. |
| Impacted Users | Sum of Daily Affected Users | Users who encountered errors. This count might include duplicates across days. |
The Errors tab includes the following charts:
| Chart | Type | Description |
|---|---|---|
| Error Trend | Area | Daily error counts. Spikes indicate system problems. |
| Top Error Codes | Horizontal bar | Top five most frequent error codes. |
| Errors by Channel | Donut | Error distribution across channels. |
| Impacted Users Trend | Area | Daily trend of users impacted by errors. |
The Error Details data table contains detailed information about each error event, including error codes, affected conversations, and impacted users.
Transcripts tab
Data source: Conversation Transcripts from Copilot Studio (Transcript Metrics table).
The Transcripts tab analyzes conversation quality: how users engage, whether sessions get resolved or escalated, and overall satisfaction. KPI cards show period-over-period trends.
| KPI | Calculation | Description |
|---|---|---|
| Conversation sessions | Sum of Session Count | Total conversation sessions in the period. |
| Engaged | Sum of Engaged Count. Engagement Rate = (Engaged Count / Session Count) x 100 | Sessions where the user sent at least one message after the greeting. |
| Avg. turns | Sum of Total Turns / Sum of Session Count | Average message exchanges per session. |
| Feedback | Sum of Like Count + Dislike Count | User feedback reactions (thumbs up/down). |
| Satisfaction score | Sum of CSAT Score / Sum of CSAT Count | Average satisfaction score on a 1-5 scale, displayed as X.X/5.0. Shown only when CSAT data exists. |
| Resolved | Sum of Resolved Count. Resolution Rate = (Resolved Count / Session Count) x 100 | Sessions marked as resolved. |
| Escalated | Sum of Escalated Count. Escalation Rate = (Escalated Count / Session Count) x 100 | Sessions escalated to a human agent. |
| Abandoned | Sum of Abandoned Count. Abandonment Rate = (Abandoned Count / Session Count) x 100 | Sessions where users left without resolution. |
The Transcripts tab includes the following charts:
| Chart | Type | Description |
|---|---|---|
| Conversation outcomes | Stacked area + KPIs | Session outcomes over time (Resolved, Escalated, Abandoned, Unengaged) with side KPIs. |
| Engagement breakdown | Donut | Engaged vs. unengaged sessions. |
| Session outcomes | Donut | Distribution of Resolved, Escalated, and Abandoned outcomes. |
| Survey satisfaction score | Stacked bar + area | Average CSAT score (1-5) with satisfaction trend over time. Satisfied: 4-5, Neutral: 3, Dissatisfied: 1-2. |
| Satisfaction score trend | Area | Daily average CSAT score over the last 45 days. Each day's score is computed as Daily CSAT Score Sum / Daily CSAT Response Count, rounded to one decimal place. Days with no survey responses are excluded. |
The Transcript metrics data table shows detailed metrics for each transcript, including engaged counts, resolved counts, escalated counts, abandoned counts, and unengaged counts.
Autonomous agent runs
When autonomous run data exists, the Transcripts tab shows additional KPIs that track the performance of autonomous (proactive) agent executions.
| KPI | Calculation | Description |
|---|---|---|
| Runs | Sum of Runs | Total number of autonomous agent runs triggered during the period. |
| Successful runs | (Sum of Successful Runs / Sum of Runs) x 100 | Percentage of autonomous runs that completed without errors. |
| Average duration | Weighted average of Average Duration (seconds), weighted by Runs per record | Weighted average duration of autonomous agent runs. |
Connected agent details
When connected agent call data exists, the Transcripts tab lists the child and connected agents that were invoked during conversations, with aggregated call and reliability metrics.
| Column | Description |
|---|---|
| Name | Name of the connected or child agent. |
| Type | Agent type with icon. One of Child Agent, Copilot Studio agent, or generic Bot. |
| Calls | Total number of times this agent was invoked. |
| Success rate | Percentage of invocations that completed successfully. |
Feedback dialog
Selecting the Feedback KPI card opens a panel that loads detailed feedback from file attachments (cat_feedbackdetailsfile). Each feedback record shows the reaction (thumbs up and thumbs down), agent name, conversation ID, conversation date, agent response, and user feedback text. The panel supports filtering by reaction type and Excel export.
Note
Feedback data is available only when Capture User Feedback is enabled in the agent configuration.
Usage history tab
Data source: Power Platform admin center (Agent Usage History table).
The Usage history tab tracks Copilot credit consumption to help you understand cost and usage patterns across environments and features.
Note
This tab appears only when usage history data exists in the system.
| KPI | Calculation | Description |
|---|---|---|
| Billed credits | Sum of Billed Copilot Credits | Total billed credits consumed. |
| Non-billed credits | Sum of Non-billed Copilot Credits | Total nonbilled credits consumed. |
The Usage history tab includes the following charts:
| Chart | Type | Description |
|---|---|---|
| Credit Consumption Over Time | Area | Billed and nonbilled credit trends over time. |
| Credits by Environment | Horizontal bar | Top 5 environments by billed credit consumption. |
| Credits by Feature | Donut | Credit distribution across Copilot features. |
This tab uses its own independent filters (Environment, Agent, Date, Feature) rather than the global filter bar.
Sync Logs tab
The Sync Logs tab shows the execution history of data synchronization flows. Use it to verify whether metric generation jobs completed successfully.
| Column | Description |
|---|---|
| Name | Sync job name. |
| Status | Execution status badge: Not Started, Running, Complete, Error, or Cancelled. |
| Cloud Flow | Link to the cloud flow run instance. Opens in a new tab. |
| Start Date | When the sync started. |
| End Date | When the sync ended. |
| Duration | Total flow execution time. |
| Error Message | Error details if the sync failed. |
| Created | When the log record was created. |
Transcripts Staging tab
The Transcripts Staging tab monitors the ingestion pipeline for transcript data. Use it to check processing status and identify stuck or failed records.
| Column | Description |
|---|---|
| Name | Record name. |
| Agent name | Agent that generated the transcript. |
| Conversation date | When the conversation occurred. |
| Conversation ID | Unique conversation identifier. |
| Channel ID | Communication channel used. |
| Data source | Badge: Production or Test Data. |
| Workflow status | Badge: Pending, Completed, or Failed. |
| Transcript ID | Unique transcript GUID. |
You can filter by workflow status (All, Pending, Completed, Failed) and refresh the list.
Understand data source differences
KPI values generated from Application Insights and from conversation transcripts can differ because of the nature of their data sources.
| Factor | Application Insights | Conversation Transcripts |
|---|---|---|
| Data availability | Telemetry logs are available as long as Application Insights retention is configured (default 90 days, configurable up to 730 days). | Conversation transcripts older than 30 days are automatically deleted by a bulk-delete system job. To change or disable this job, see Change the default retention period. |
| Data completeness | Captures data only if telemetry logging is enabled and the agent is connected to Application Insights. | Captures all conversations regardless of Application Insights integration. |
| Metrics focus | Response times, tool performance, error details, topic execution. | Session outcomes, engagement, CSAT, user feedback. |
| Granularity | Event-level telemetry aggregated daily. | Session-level aggregated daily. |
Use Application Insights metrics (Overview, Daily Metrics, Topics, Tools, Actions, Errors tabs) for performance monitoring and debugging. Use Conversation Transcripts metrics (Transcripts tab) for conversation quality and customer satisfaction analysis.
Build dashboards and forecasts (preview)
Dashboards and forecasting is an integrated analytics experience that you can use to build custom dashboards and forecasts directly from your agent metrics. It's designed for program leads, makers, and business stakeholders who want to visualize agent performance, track adoption trends, and explore projections.
Highlights:
- Build drag-and-drop dashboards from more than 100 available metrics.
- Forecast trends up to 180 days with built-in prediction models.
- Export dashboards and charts to PDF, PowerPoint, Excel, or PNG.
- Run on the same Dataverse data that powers Agent Insights Hub. No extra setup is required.
Note
This feature is currently in preview. It uses the same data already synced by Agent Insights Hub, so no extra configuration is required.
Access dashboards and forecasts
- Open Agent Insights Hub in the Copilot Agent Kit app.
- Select Build dashboard & forecast in the header area.
- The feature opens in a full-screen view with three tabs: Dashboards, Forecast, and Metrics.
- To return to Agent Insights Hub, select the back arrow.
Dashboards tab
The Dashboards tab provides a drag-and-drop canvas where you can arrange metric charts to create personalized views.
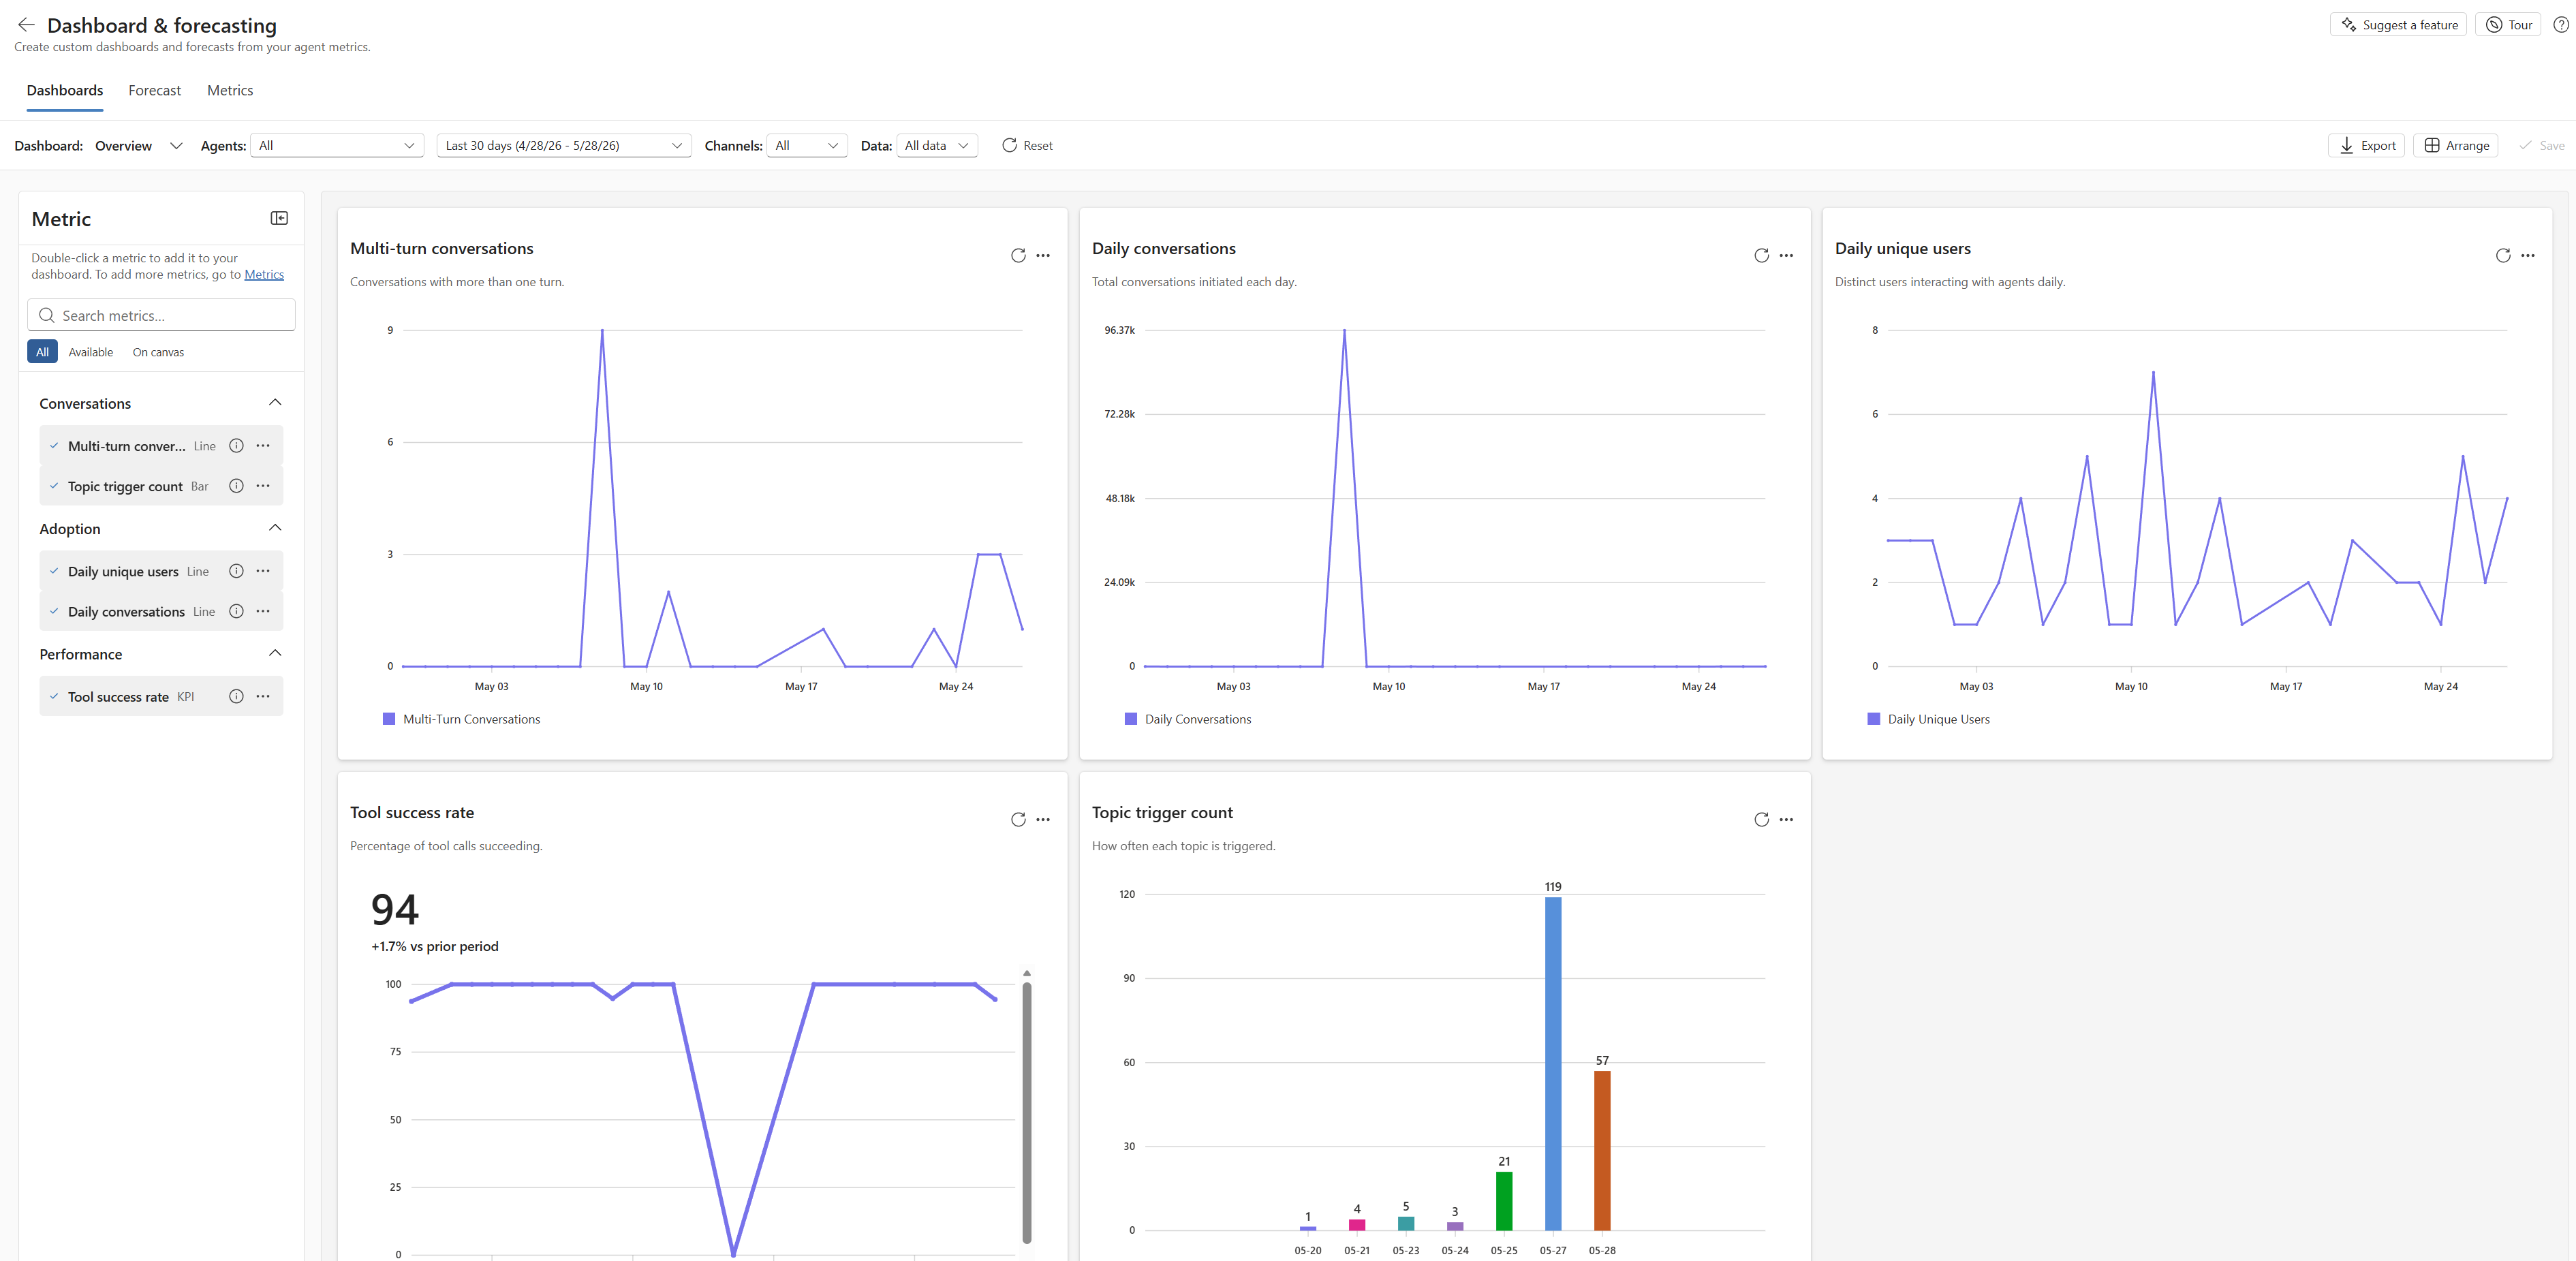
| Action | Description |
|---|---|
| Add metrics | Drag metrics from the sidebar onto the canvas to create chart cards. |
| Arrange charts | Drag, drop, and resize cards to organize your layout. Use Arrange to autoalign all cards into a uniform grid. |
| Filter data | Use the filter bar to narrow data by agent, time range, channel, or data mode (production vs. test). |
| Save dashboards | Save your layout to keep it for next time. Create multiple dashboards for different audiences or use cases. |
| Export | Export your dashboard as a PDF, PowerPoint, or Excel file to share with stakeholders. |
The Dashboards tab uses the following filters:
| Filter | Description |
|---|---|
| Agent | Show data for a specific agent or all agents. |
| Time range | Choose a preset (last 7, 30, or 90 days) or set a custom date range. |
| Channel | Filter by communication channel (Teams, Web Chat, Direct Line, and others). |
| Data mode | Switch between production data, test data, or both. |
Forecast tab
The Forecast tab helps you answer the question Where will this metric be in 30 days? by using built-in prediction models that run directly in your browser.
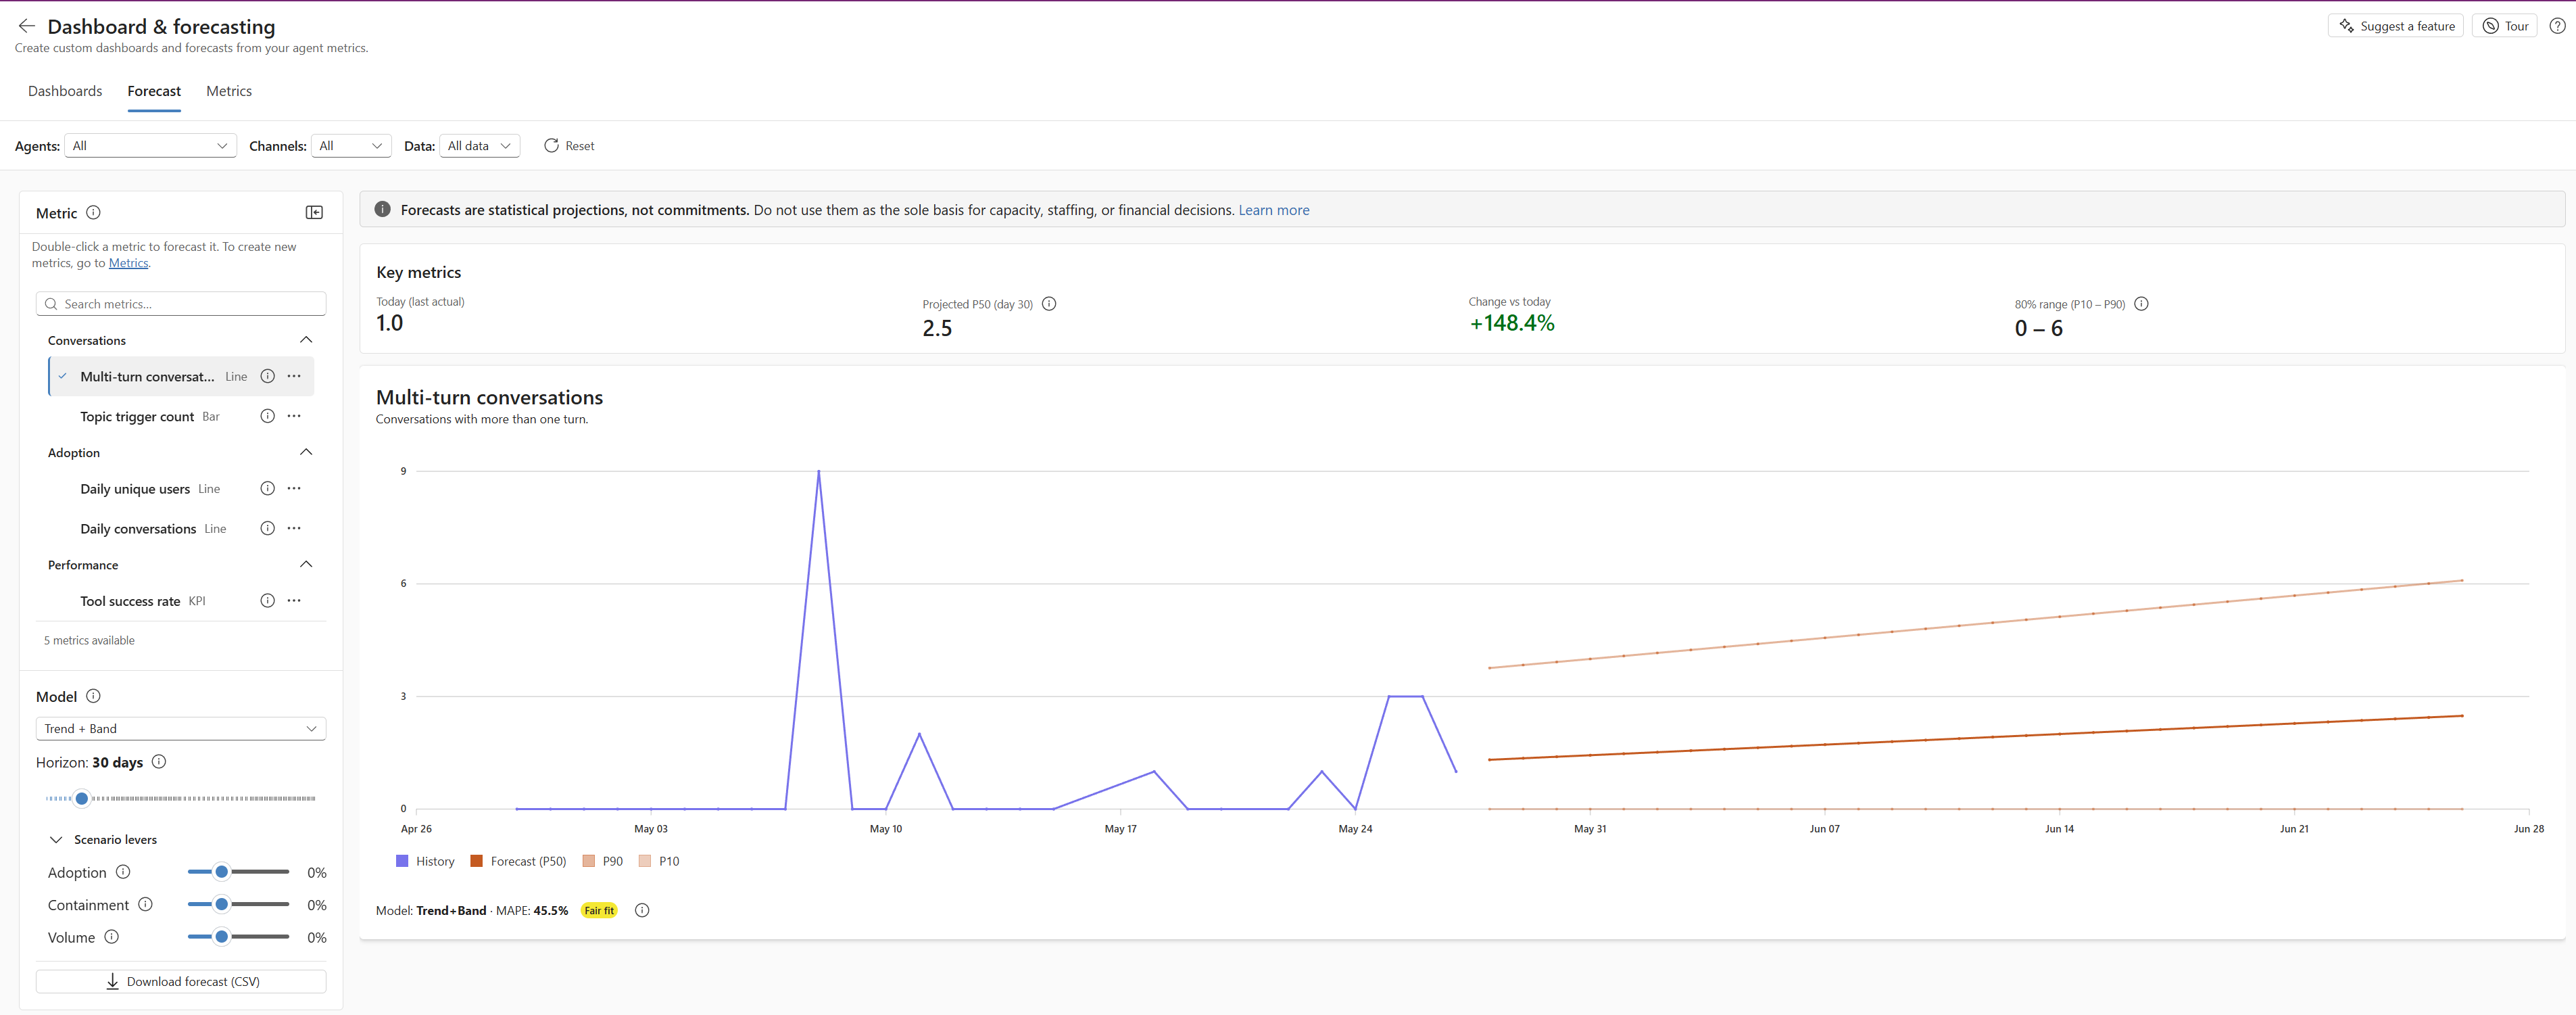
To use Forecast:
- Select a metric from the categorized list on the left (for example, daily conversations or CSAT score).
- Choose a model. Pick between Trend + Band (linear trend) or ETS / Holt (exponential smoothing), depending on your data pattern.
- Set the horizon. Use the slider to project anywhere from 7 to 180 days into the future.
- Adjust scenario levers. Explore what-if scenarios by adjusting adoption, containment, or volume assumptions.
The workspace displays key metrics at the top (today's value, projected value, expected change, and confidence range) along with a chart showing the historical data and forecasted trend with confidence bands.
Note
Forecasting is a directional communication tool to help you estimate trends and communicate projections to stakeholders. It isn't intended as a scientific prediction engine.
Metrics tab
Use the Metrics tab to manage the metrics you can use across your dashboards and forecasts. You can browse a library of recommended metrics organized by domain, or you can create your own custom metrics.
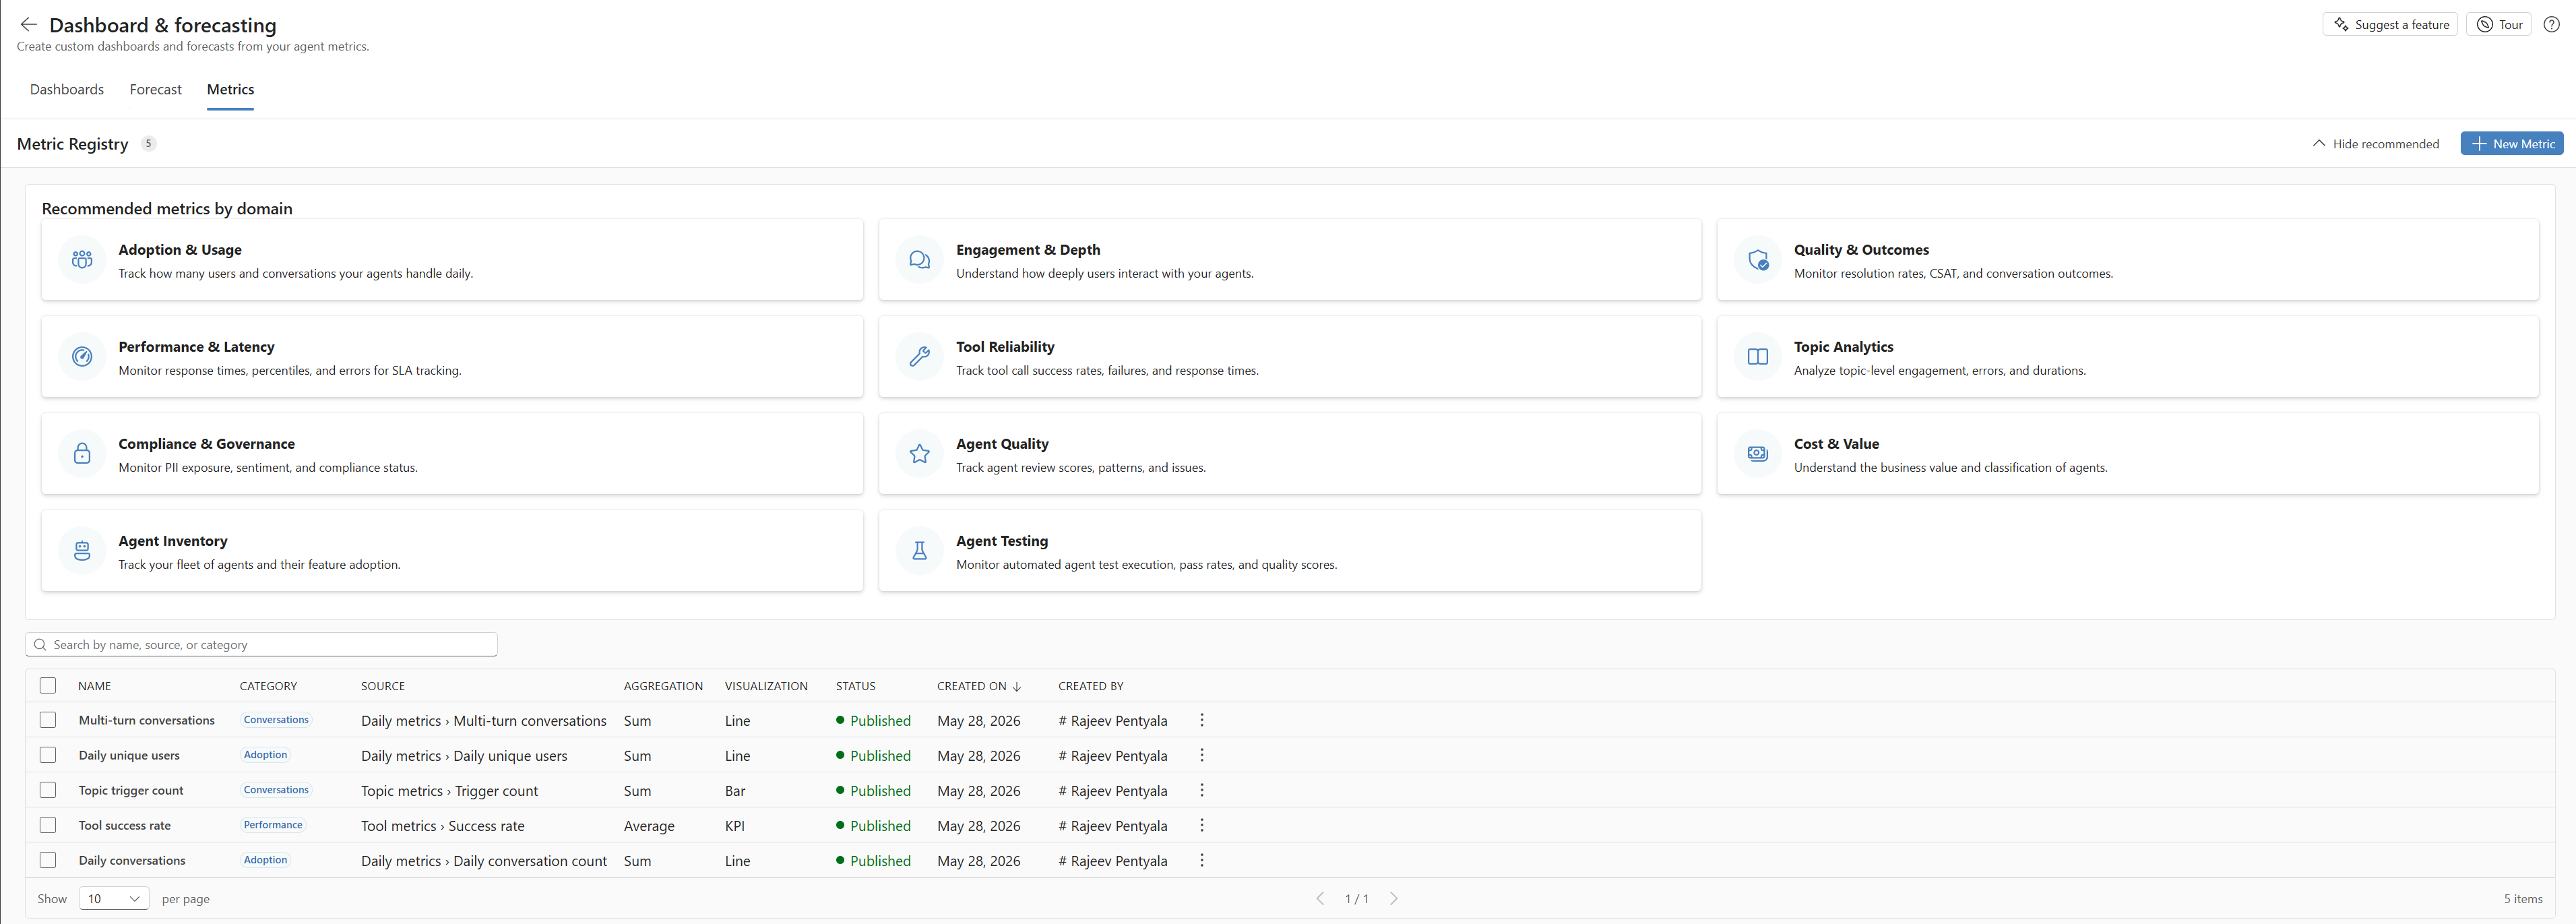
Recommended metrics are organized into domains such as:
- Conversations & Outcomes: session counts, resolution, escalation.
- Performance & Latency: response times, duration, error rates.
- Agent Inventory & Usage: agent counts, credit consumption.
- Quality & Compliance: CSAT, sentiment, PII violations.
- Agent Testing: test success rates, latency, alignment scores.
Select a domain card to open a picker where you can choose which metrics to add to your registry.
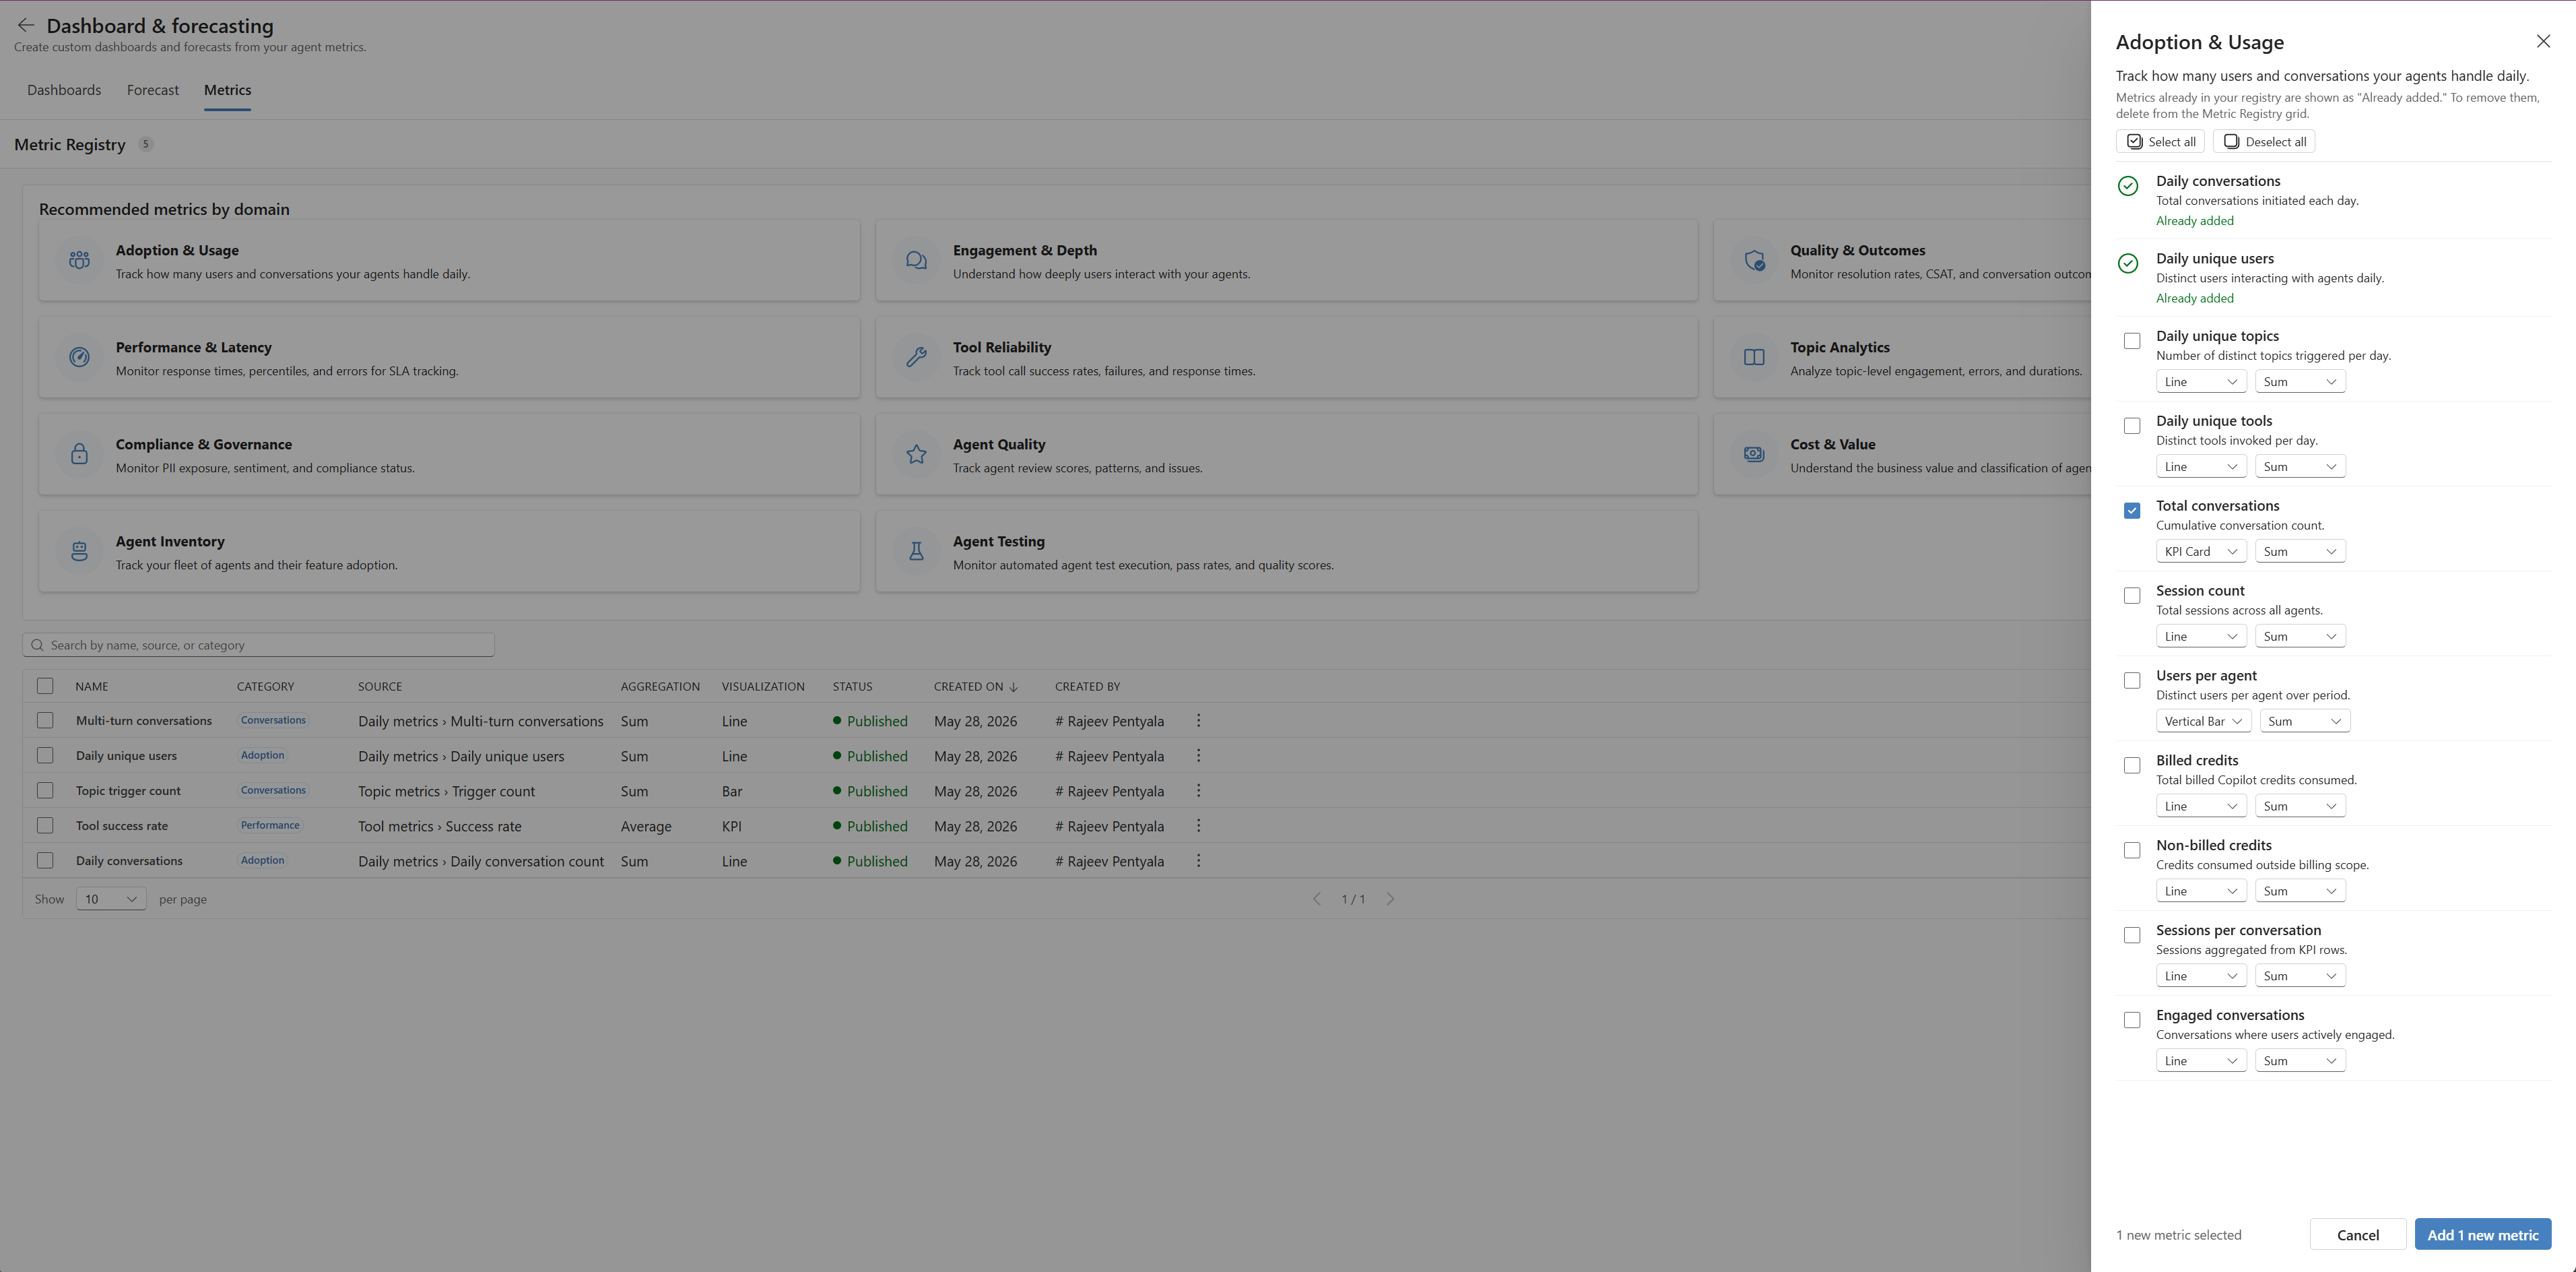
To create a custom metric:
- Select + New Metric from the Metrics tab.
- Choose a source table, such as Daily Metrics or Tool Metrics.
- Choose a source field, such as daily conversation count.
- Pick an aggregation: Sum, Average, Count, Min, Max, or Latest.
- Pick a visualization: KPI tile, Line chart, Bar chart, Donut, Area, or Table.
- Give it a name and description, and then save.
Your custom metric appears in the sidebar and is ready to drag onto any dashboard.
Troubleshooting
The following sections describe how to validate a sync and resolve common issues.
Validate a sync
After each sync, verify the result:
- Open the Sync logs tab and verify that the sync job status is Complete. If the status is Error, check the Error Message column for details and the Cloud Flow link for the full run history.
- For transcript data, open the Transcripts staging tab and verify that staging records have Completed status. If records are stuck in Pending or show Failed:
- Filter by Failed status to identify problematic records.
- Check whether the conversation transcript data is still available. Transcripts older than 30 days might be deleted.
- Resync the affected date range.
Common issues
| Issue | Possible cause | Resolution |
|---|---|---|
| No data after sync | Application Insights isn't connected to the agent. | Verify the Application Insights integration in Copilot Studio under Settings > Advanced. |
| Sync job shows Error | Invalid Application Insights credentials. | Check the Application ID, Tenant ID, Client ID, and secret in the agent configuration. |
| "No insights yet" on all tabs | No sync has been run. | Select Sync and run a sync for your desired date range. |
| Partial data on some tabs | KPI source isn't selected. | Edit the agent configuration and make sure the correct KPI sources are selected (Application Insights, Conversation Transcripts, Usage History). |
| Transcript data missing for older dates | Transcripts deleted after 30 days. | A bulk-delete system job removes transcripts older than 30 days. Sync regularly to capture data before it expires, or disable or modify the job. Learn more in Change the default retention period. |
| Usage history tab not visible | No usage data is available. | The Usage history feature requires the HTTP with Microsoft Entra ID (preauthorized) connection to the Power Platform licensing API. Configure the connection using the Base Resource URL for your cloud as described in View usage metrics. Requires Power Platform admin role and system admin permissions. |
| Filters return no results | Restrictive filter combination. | Try resetting to default filters (All agents, Last 90 days, All channels, Production). |
| Run button is greyed out in the Sync dialog | No configuration selected. | Select an agent configuration or All Agents from the dropdown before selecting Run. |