Note
Access to this page requires authorization. You can try signing in or changing directories.
Access to this page requires authorization. You can try changing directories.
On the Agents page of Copilot Studio, makers can determine in a single agent-level status if published agents comply with security and governance standards and verify that an agent's threat detection is active. For more information, see Key concepts - Copilot Studio security and governance.
The security status of published agents appears in the Protection status column on the Agents page. By displaying the protection status for each agent as one of Protected, Needs review, or Unknown, makers can quickly determine when threat detection is active and their agents are protected.

The possible values a published agent might have under Protection status are Protected, Needs review, and Unknown.
When the agent-level status of an agent is Protected, no immediate action is required (based on detected signals). When the status is Protected, a green shield is displayed to visually emphasize that this agent is protected (
![]() ).
).
When the agent-level status is Needs review, either the agent's policies are violated or authentication is inadequate. Regardless of the status, makers can drill down to see an agent-level summary dialog with more information about their agent's security broken down into categories.
Select the status of your agent in the Protection status column to see an agent-level summary dialog of your agent's protection status.
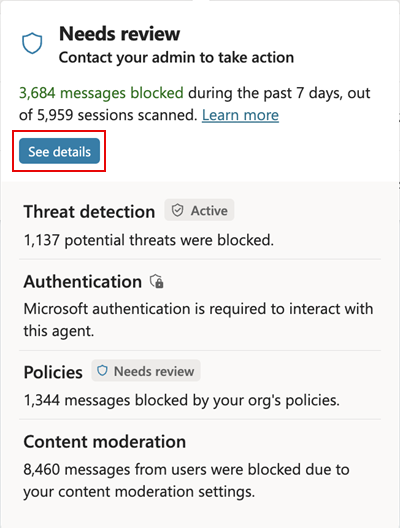
Protection status summary
On the protection status summary dialog, the protection profile of your agent is broken into three categories: Authentication, Policies, and Content moderation. Each of these categories has a possible status of Protected, Needs review, or Unknown, as with the agent-level summary status on the Agents page.
Additionally, this dialog displays the number of blocked messages due to potential threats, policy violations, and violations of content moderation settings. Potential threats are either direct or indirect. For example, a potential threat might be in the form of a user overriding security settings with admin access. Alternatively, a potential threat might be a referenced knowledge source. All published agents automatically have threat detection enabled and display the Active label.
As with agent-level protection status, if either Authentication or Policies are in violation of accepted security standards, as defined by your agent's security setup, a Needs review label appears next to the category in the summary dialog. If either of these categories has a Needs review label, this label rolls up to the single agent-level protection status on the Agents page.
From the agent-level summary protection dialog, if you want to see more detail, select See details to open the Security analytics dialog.
Security analytics
The Security analytics dialog displays statistics and trends about blocked messages and the agent's status in the categories of authentication, policies, and content moderation.
Select the date range of security analytics data you want to see. If you don't have data that falls within one or more of the following ranges, those ranges don't appear as selectable options in the date range picker. Select from the following range options:
- Last 7 days
- Last 14 days
- Last 30 days

The Reason for block stacked bar chart breaks down the sum of all blocked messages in the configured time frame into color-coded bar segments whose individual lengths signify the proportional share for each blocking reason. For example, in the graphic, there are 496 blocked messages in the last seven days. Of these blocked messages, 79.6% are blocked as potential threats (pink bar segment) with about 60% of the total number of blocked messages being direct prompt attacks. A quick glance at the Session block rate trend graph shows the rate of message blocking due to the detection of potential threats peaks on May 23.
The Session block rate trend graph charts the share of the total number of sessions in which a prompt was blocked as a trend line over time. Each of the three categories of protection is individually represented as separate, color-coded trend lines, using the same color-coding as the Reason for block bar chart. For more information about conversational sessions, see Conversational sessions.
| Threat detection or protection category | Description | Action |
|---|---|---|
| Threat detection | This component shows statistics on blocked prompt attacks, which are actively blocked by default. It provides makers with insights into the number of attacks and trends, helping them understand the security landscape of their agents. | |
| Authentication | This component indicates whether the agent requires end-user authentication or is public. If an autonomous agent is public, it might expose sensitive data to potential attackers or unauthorized individuals. In such cases, the status reflects a possible threat vector that might require the maker's attention. | Select Open settings to go to your agent's Settings > Security > Authentication page, where you can select an authentication method. |
| Policies | This component reflects policy violations set by admins in the Power Platform admin center. Agents might violate these policies, and makers need to be aware of these violations and make necessary adjustments. For example, an organizational data policy might block a connector an agent tries to use. | Make the required changes in your agent so that it complies with your org's policies. To review errors due to policies, select the Review errors link under Policies. If, instead, it's necessary to change your org's policies, and you have access, select Open admin center to go to the Power Platform admin center so you can view or edit your org's policies. |
| Content moderation | This component doesn't affect the protection status directly but is part of the statistics and trends available to the maker. It helps ensure that the content generated by the agent adheres to the desired sensitivity levels. | Select Open settings to go to your agent's Settings > Generative AI page, and under Moderation > Content moderation level, adjust the slider to the desired content moderation level. |