Note
Access to this page requires authorization. You can try signing in or changing directories.
Access to this page requires authorization. You can try changing directories.
This article walks you through six demo pages to demonstrate resolving JavaScript errors that are reported in the Console.
Fix JavaScript errors
A major role of the Console is to display any JavaScript errors that are found in the webpage.
Demo page: JavaScript error reported in the Console tool
Open the demo webpage JavaScript error reported in the Console tool in a new window or tab.
Right-click anywhere in the webpage and then select Inspect. Or, press F12. DevTools opens next to the webpage.
Click the Console button in the Activity Bar. In DevTools, the Console gives you more information about the error:
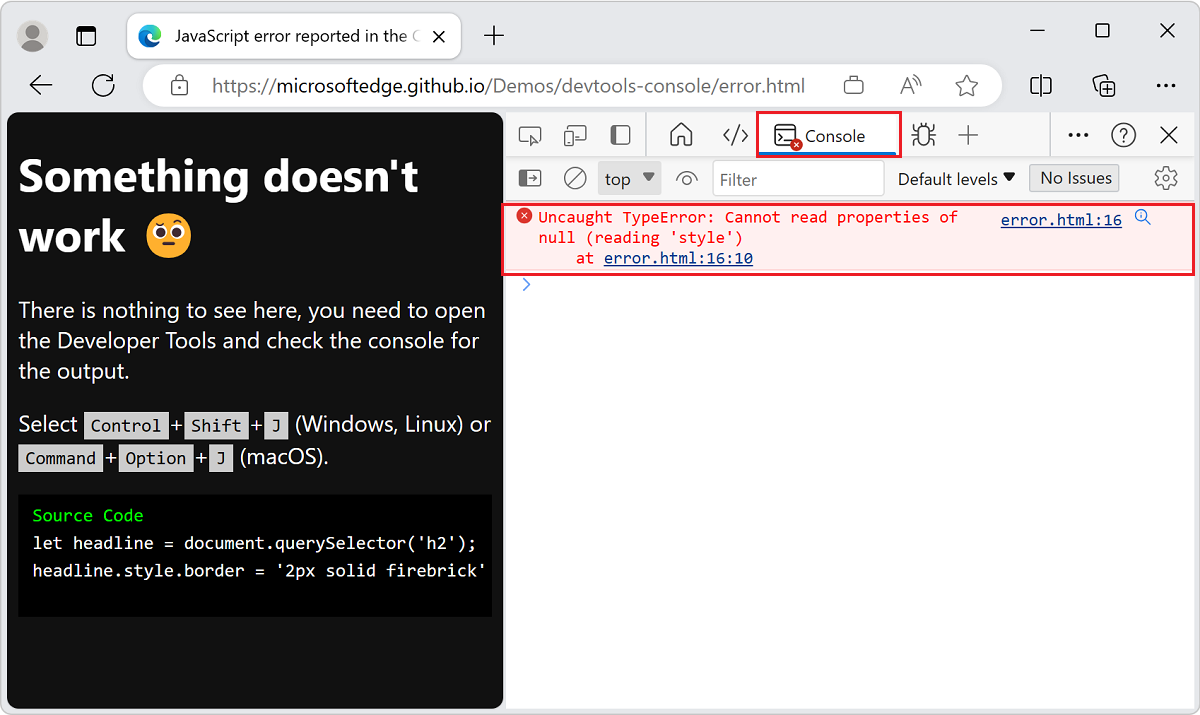
Many error messages in the Console have a Search for this message on the Web button, shown as a magnifying glass. For more information, see Search the web for a Console error message string.
The information in this error message suggests that the error is on line 16 of the
error.htmlfile.Click the
error.html:16link on the right of the error message in the Console. The Sources tool opens and highlights the line of code with the error: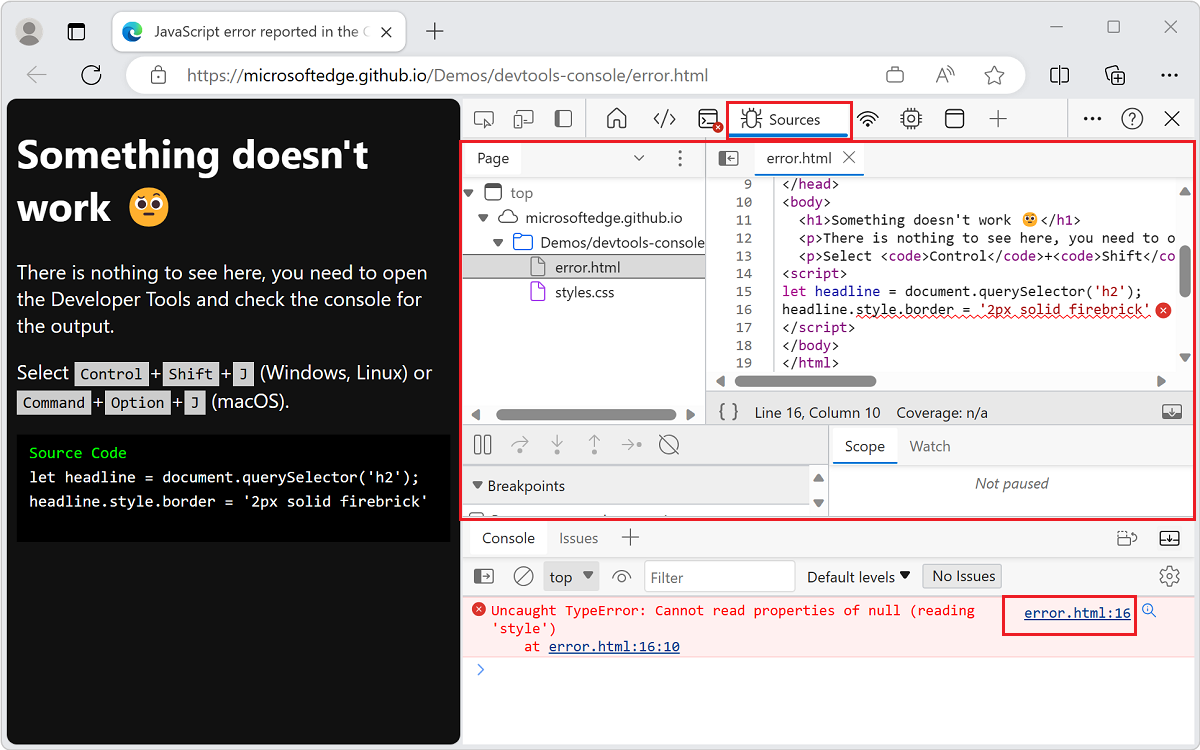
The script tries to get the first
h2element in the document and paint a red border around it. But noh2element exists, so the script fails.
Find and debug network issues
The Console reports network errors.
Demo page: Network error reported in Console
Open the demo webpage Network error reported in Console in a new window or tab.
Right-click anywhere in the webpage and then select Inspect. Or, press F12. DevTools opens next to the webpage.
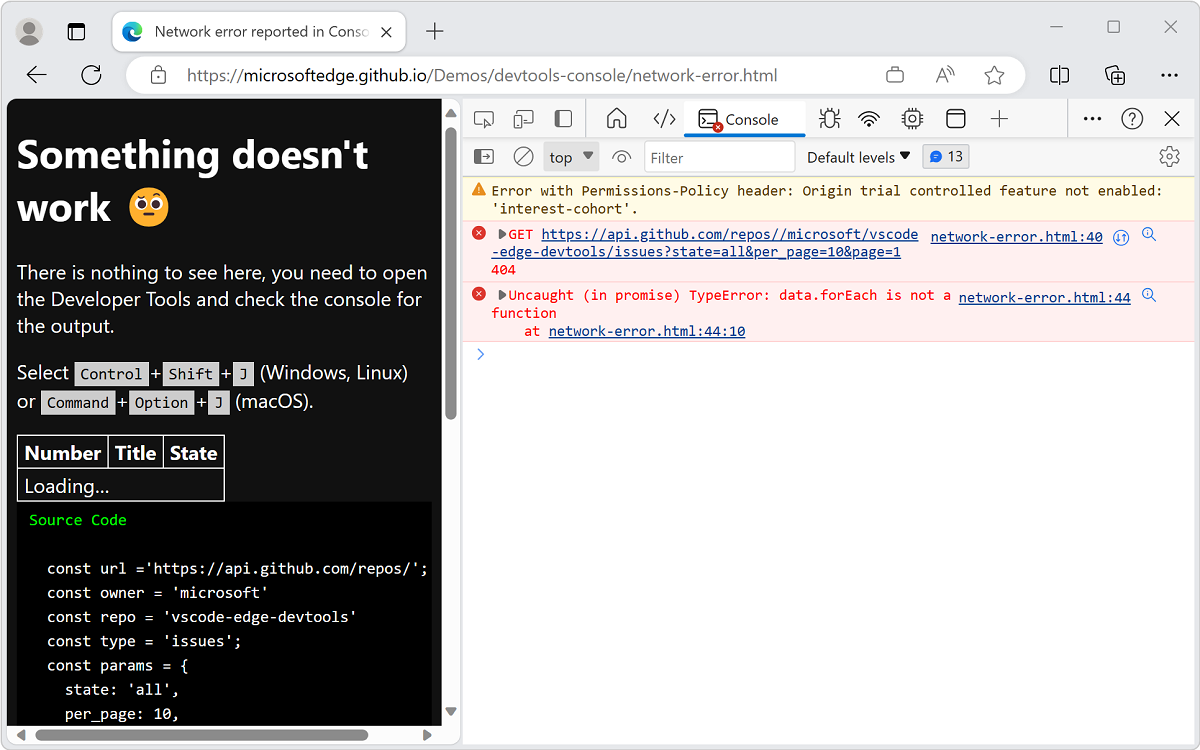
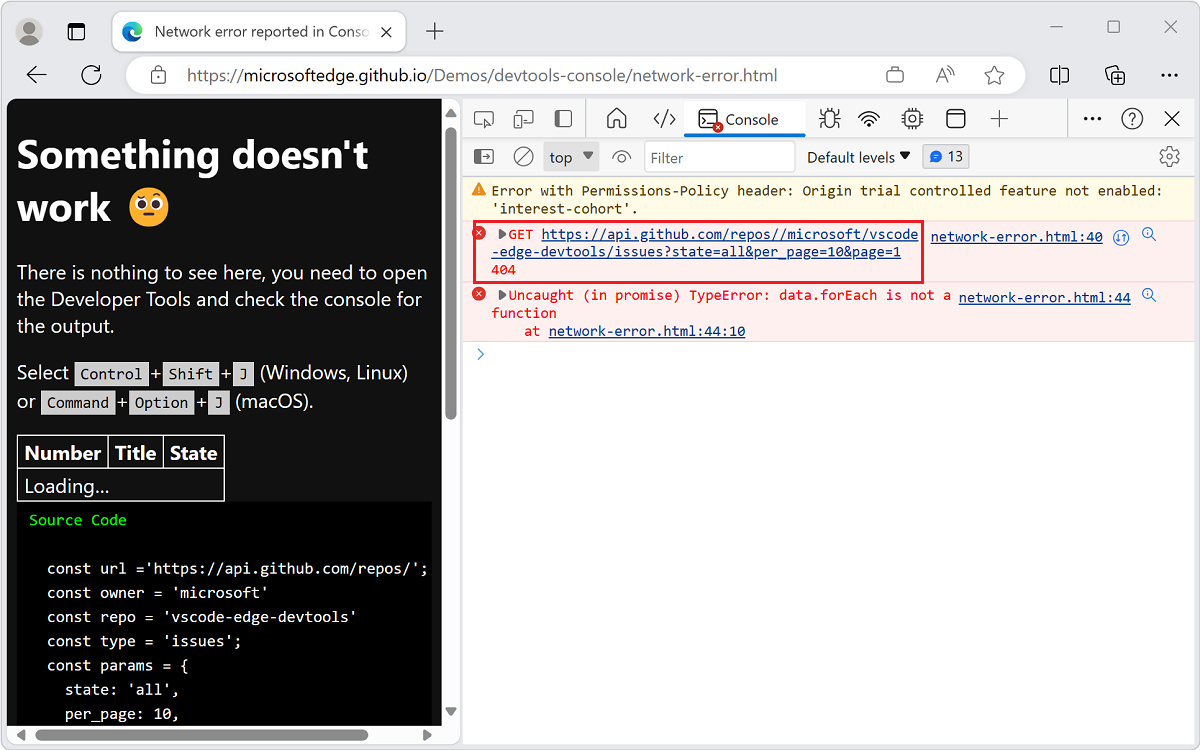
The table displays
loading, but nothing changes on the webpage, because the data is never retrieved. In the Console, the following two errors occurred:A network error that starts with
GETHTTP method followed by a URI.An
Uncaught (in promise) TypeError: data.forEach is not a functionerror.
Click the link to the webpage and line of code where the error occurs, to open the Sources tool. That is, click the
network-error.html:40link in the Console: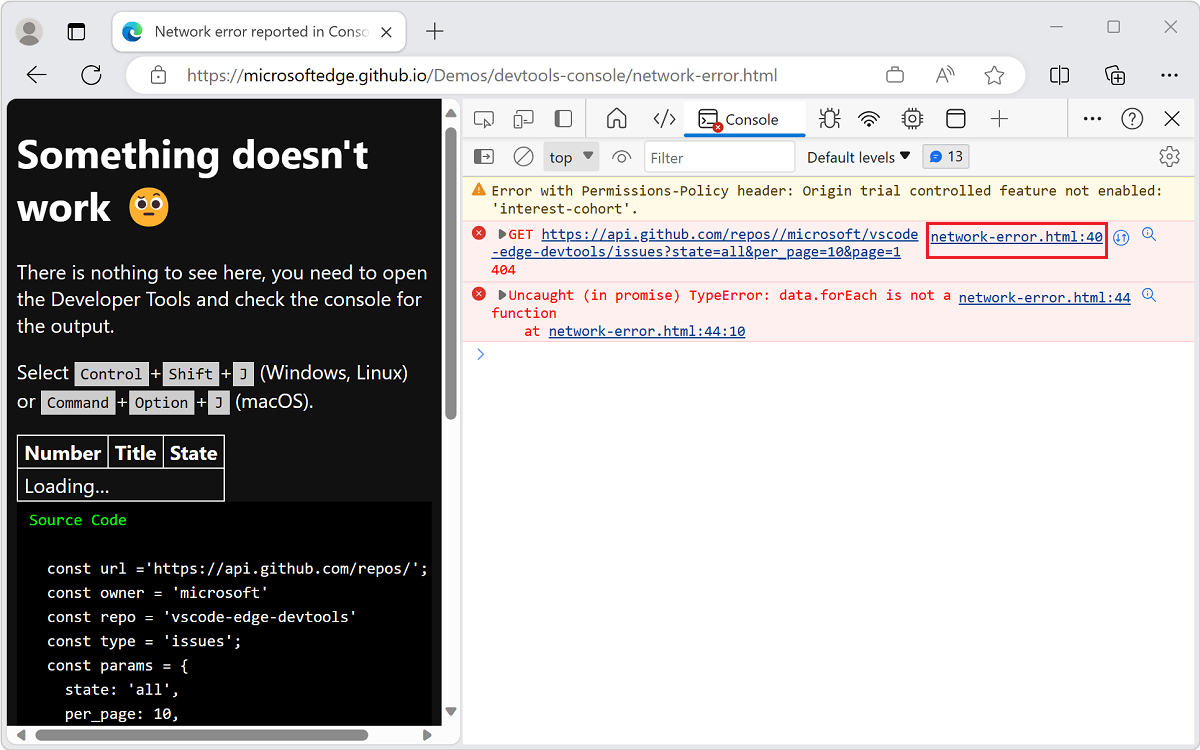
The Sources tool opens. The problematic line of code is highlighted and followed by an
error(x) button.Click the error (
x) button. The messageFailed to load resource: the server responded with a status of 404 ()appears.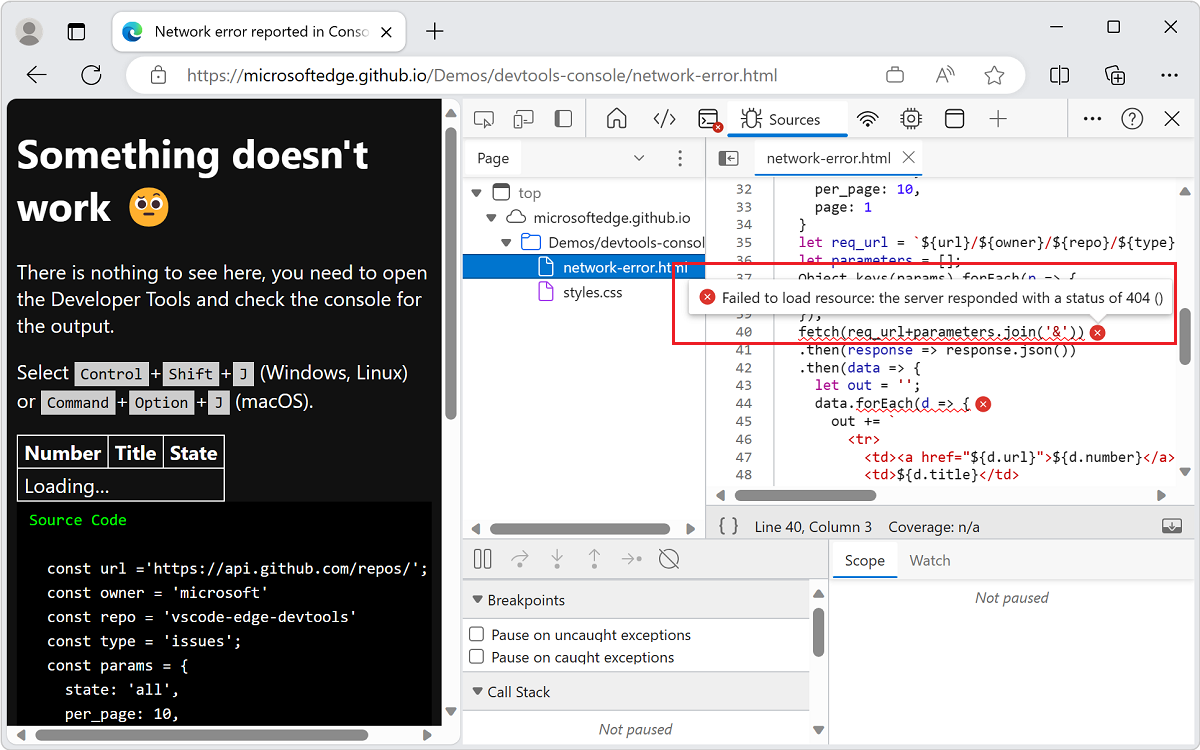
This error informs you that the requested URL isn't found.
Open the Network tool, as follows: open the Console, and then click the URI that's associated with the error.
The Console displays an HTTP status code of the error after a resource isn't loaded:
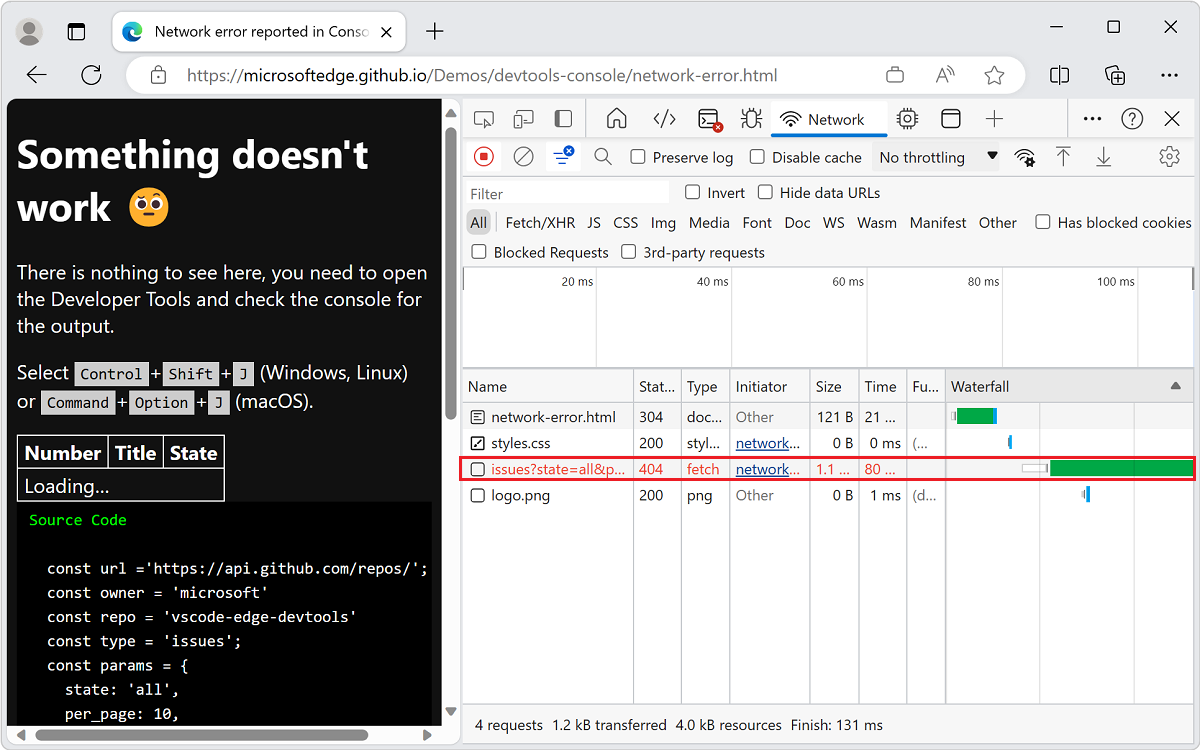
The Network tool displays more information about the failed request:
Inspect the headers in the Network tool to get more insight:
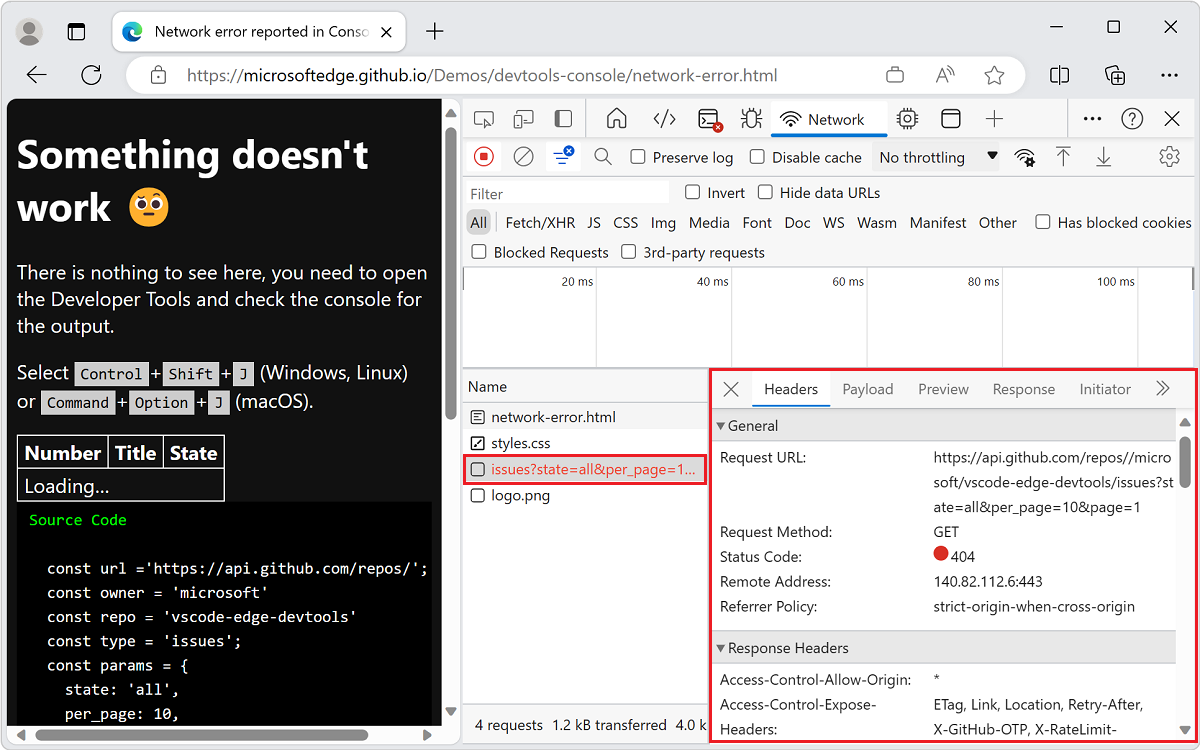
What was the problem? Two slash characters (
//) occur in the requested URI after the wordrepos.Open the Sources tool and inspect line 26. A trailing slash character (
/) occurs at the end of the base URI. The Sources tool displays the line of code with the error: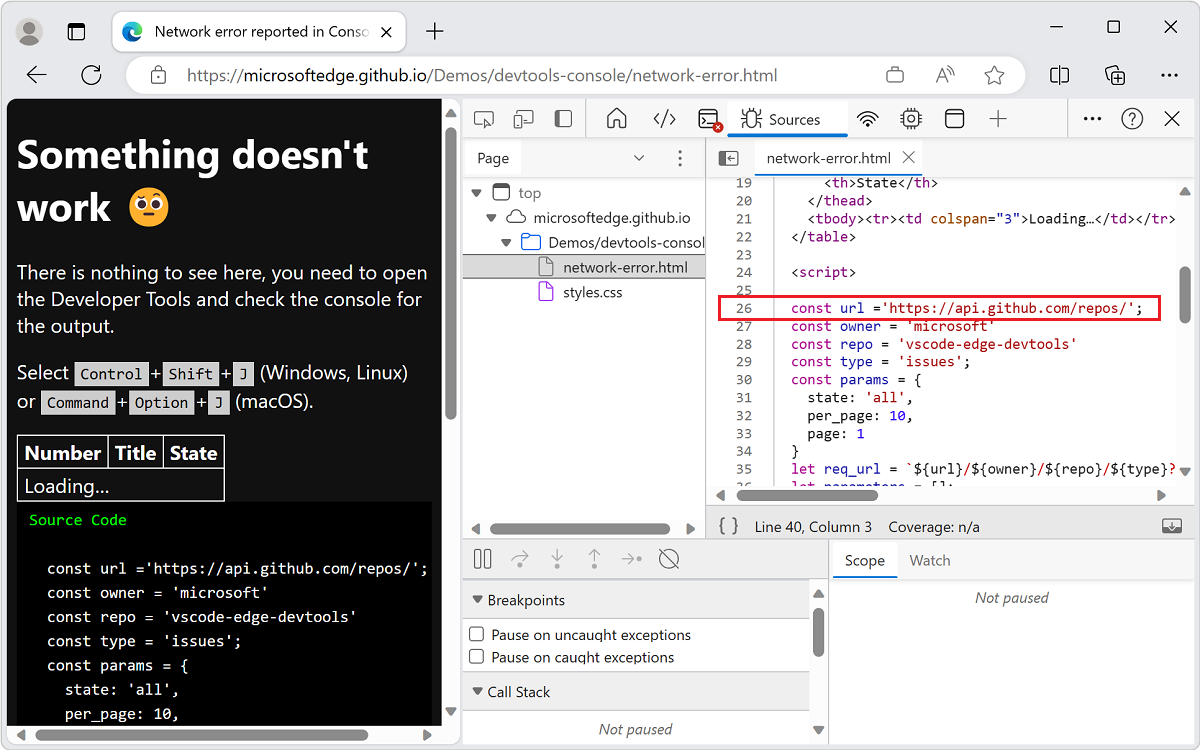
Viewing the resulting page when there are no errors in the Console
Next, we'll look at the resulting page when there are no errors in the Console.
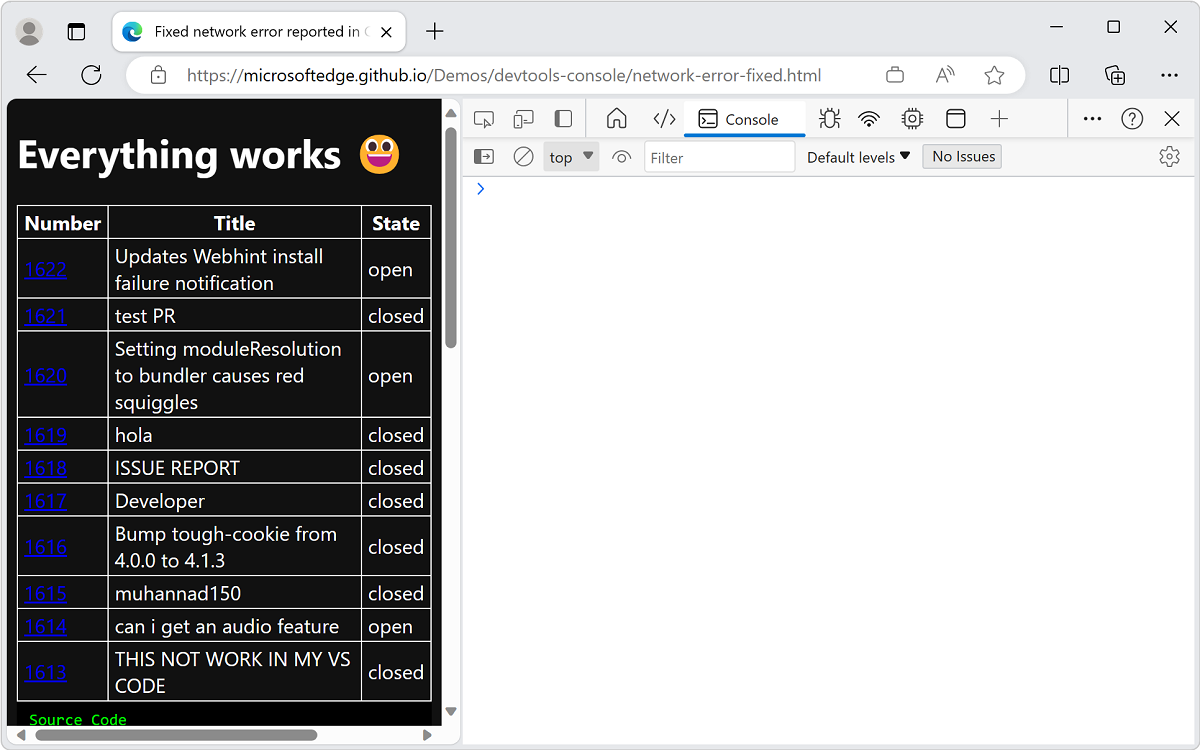
Demo page: Fixed network error reported in Console
Open the demo webpage Fixed network error reported in Console in a new window or tab.
The example without any errors loads information from GitHub and displays it:
Demo page: Network error reporting in Console and UI
Use defensive coding techniques to avoid the previous user experiences. Make sure your code catches errors and displays each error in the Console, as follows:
Open the demo webpage Network error reporting in Console and UI in a new window or tab.
Right-click anywhere in the webpage and then select Inspect. Or, press F12. DevTools opens next to the webpage.
The example webpage demonstrates these practices:
Provide a UI to the user to indicate that something went wrong.
In the Console, provide helpful information about the Network error from your code.
The example catches and reports errors:
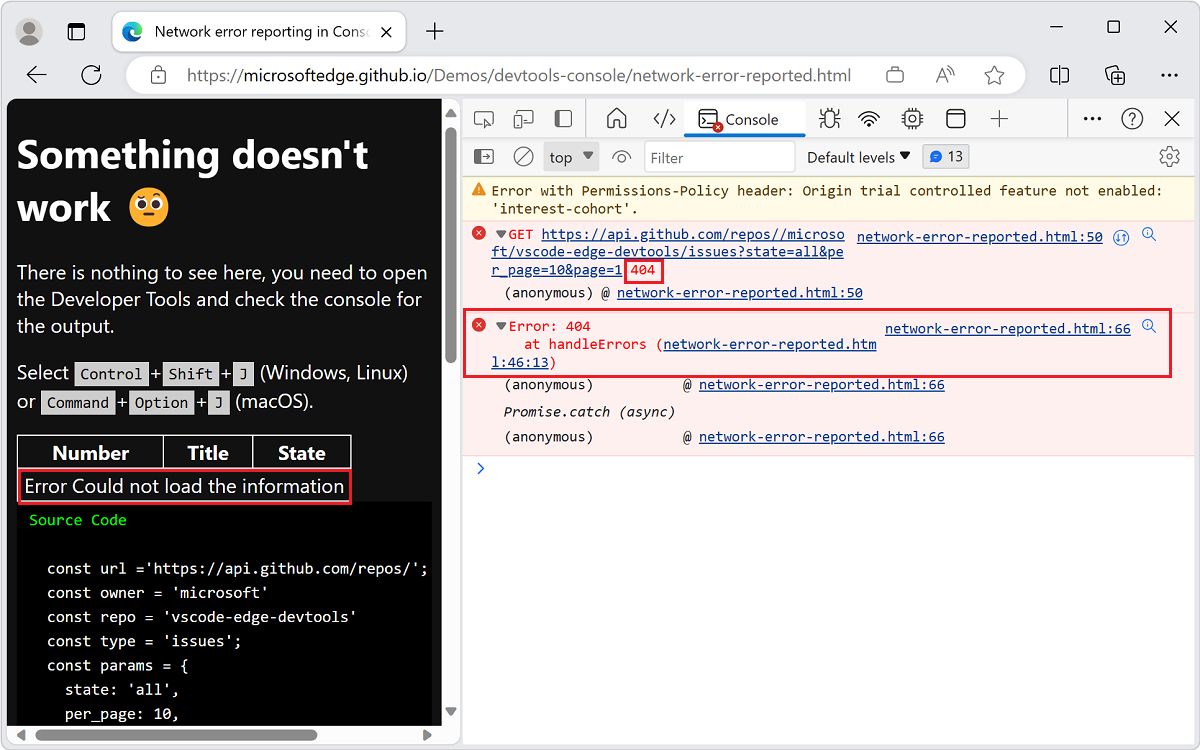
The following code in the demo catches and reports errors using the
handleErrorsmethod, specifically thethrow Errorline:const handleErrors = (response) => { if (!response.ok) { let message = 'Could not load the information' document.querySelector('tbody').innerHTML = ` <tr><td colspan=3>Error ${message}</td></tr> `; throw Error(response.status + ' ' + response.statusText); } return response; };
Create errors and traces in the Console
Besides the throw Error example in the previous section, you can also create different errors and trace problems in the Console.
Demo page: Creating error reports and assertions in Console
To display two created error messages in the Console:
Open the demo page Creating error reports and assertions in Console in a new window or tab.
Right-click anywhere in the webpage and then select Inspect. Or, press F12. DevTools opens next to the webpage.
Error messages appear in the Console:
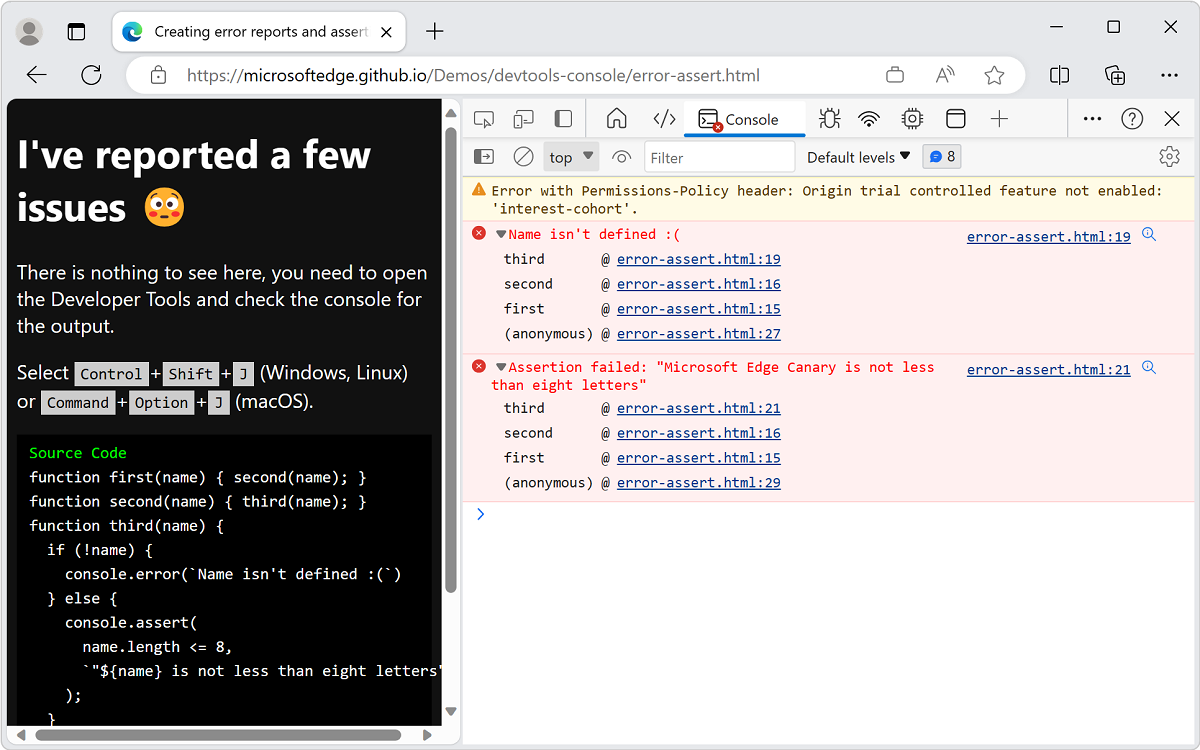
The demo page uses the following code:
function first(name) { second(name); }
function second(name) { third(name); }
function third(name) {
    if (!name) {
        console.error(`Name isn't defined :(`)
    } else {
        console.assert(
            name.length <= 8,
            `"${name} is not less than eight letters"`
        );
    }
}
first();
first('Console');
first('Microsoft Edge Canary');
There are three functions that request each other in succession:
first()second()third()
Each function sends a
nameargument to the other. In thethird()function, you check if thenameargument exists and if it doesn't, you log an error that name isn't defined. Ifnameis defined, you use theassert()method to check if thenameargument is fewer than eight letters long.You request the
first()function three times, with the following parameters:No argument that triggers the
console.error()method in thethird()function.The term
Consoleas a parameter to thefirst()function doesn't cause an error becausenameargument exists and is shorter than eight letters.The phrase
Microsoft Edge Canaryas a parameter tofirst()function causes theconsole.assert()method to report an error, because the parameter is longer than eight letters.
The demo uses the
console.assert()method to create conditional error reports. The following two examples have the same result, but one needs an extraif{}statement:let x = 20; if (x < 40) { console.error(`${x} is too small`) }; console.assert(x >= 40, `${x} is too small`)The second and third lines of the code perform the same test. Because the assertion needs to record a negative result:
- You test for
x < 40in theifcase. - You test for
x >= 40for the assertion.
Demo page: Creating traces in Console
If you aren't sure which function requests another function, use the console.trace() method to track which functions are requested in order to get to the current function.
To display the trace in the Console:
Open the demo page Creating traces in Console in a new window or tab.
Right-click anywhere in the webpage and then select Inspect. Or, press F12. DevTools opens next to the webpage.
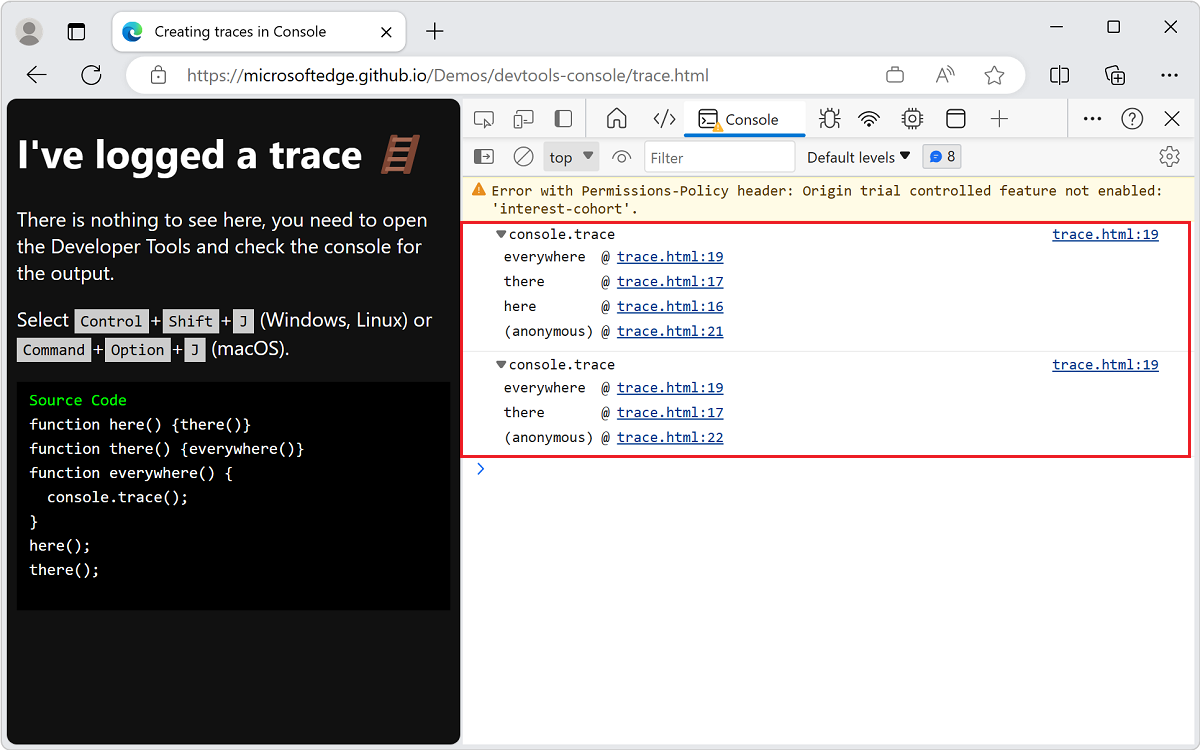
The page uses this code:
function here() {there()}
function there() {everywhere()}
function everywhere() {
   console.trace();
}
here();
there();
The result is a trace to display that
here()is namedthere()and theneverywhere(), and in the second example to display that it's namedeverywhere().Here's the trace that's produced, in the Console:
See also
- Console overview - General use of the Console to display and resolve error messages.