Note
Access to this page requires authorization. You can try signing in or changing directories.
Access to this page requires authorization. You can try changing directories.
Ever since browsers started to offer developer tools, the Console is a favorite, because in most programming courses, you learn to output some kind of print or log command, to gain insights about what happens in your code.
Before DevTools, for JavaScript, you were limited to an alert() or document.write() statement to debug in the browser. With DevTools, to log information in the Console, many methods of the Console object are available in the Console, listed in Console object API Reference.
Levels of Console log messages: console.log, .info, .error, and .warn
The console object has methods to log various levels of messages:
console.log- Prints the text to the Console as a log message.console.info- Prints the text to the Console as an informational message.console.error- Prints the text to the Console as an error message.console.warn- Prints the text to the Console as a warning.
Example code for levels of Console log messages
// prints the text to the console as  a log message
console.log('This is a log message')

// prints the text to the console as an informational message
console.info('This is some information')

// prints the text to the console as an error message
console.error('This is an error')

// prints the text to the console as a warning
console.warn('This is a warning')
Demo webpage for levels of Console log messages
To try using the logging functions in the Console:
Open the demo webpage Console messages examples: log, info, error, and warn in a new window or tab.
Press Ctrl+Shift+J (Windows, Linux) or Command+Option+J (macOS).
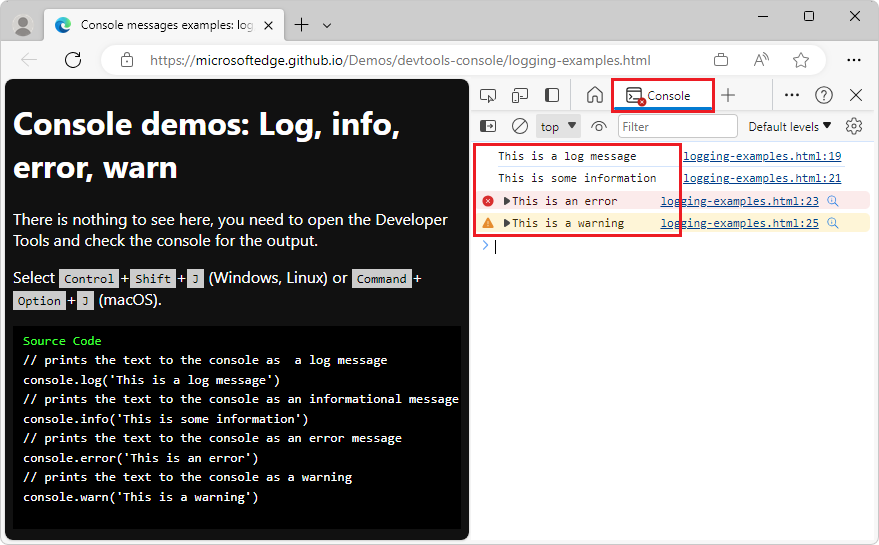
DevTools opens, with the Console open in the Activity Bar. The demo page has already sent the above log messages to the Console:
The
log()andinfo()methods seem to do the same thing. Useinfo()andlog()for different log tasks, because that allows you to filter Console messages, to display only a subset of log entries.The
error()andwarn()methods display an icon next to the message and a way to inspect the stack trace of the message.Copy and paste any of the examples into the Console, and then press Enter.
Output is displayed in the Console, below the code that you entered.
Logging various types of values
Instead of logging text values, you can send any valid JavaScript or DOM references to the Console. The Console appropriately displays the various types of JavaScript values that you send to it from console log messages. The Console displays a filtered and formatted representation of the results.
Example code for logging various types of values
let x = 2;

// logs the value of x
console.log(x);

// logs the name x and value of x
console.log({x})

// logs a DOM reference
console.log(document.querySelector('body'));

// logs an Object
console.log({"type":"life", "meaning": 42});
let w3techs = ['HTML', 'CSS', 'SVG', 'MathML'];

// logs an Array
console.log(w3techs);
Demo webpage for logging various types of values
To use the log function to display different variable types:
Open the demo webpage Console messages examples: Logging different types in a new window or tab.
Press Ctrl+Shift+J (Windows, Linux) or Command+Option+J (macOS).
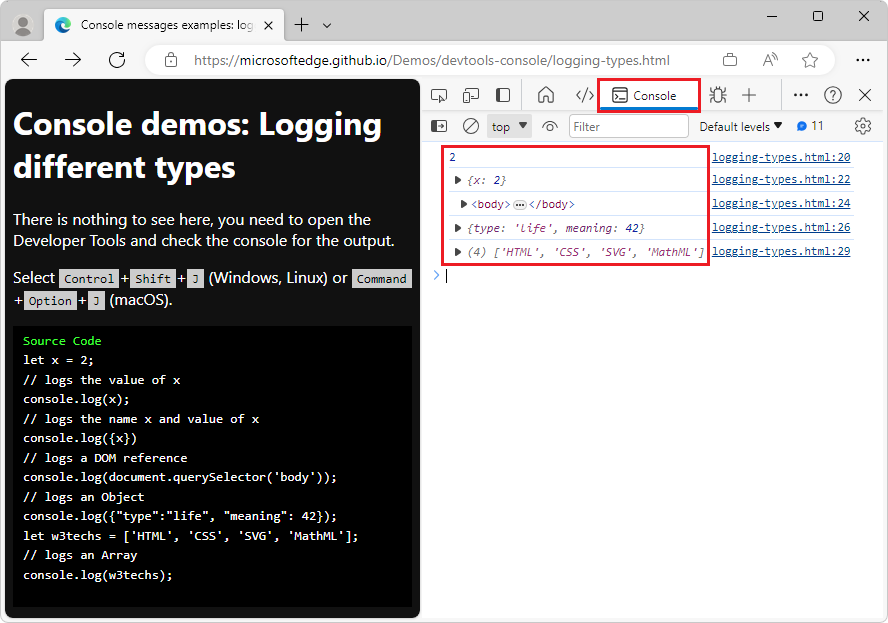
DevTools opens, with the Console open in the Activity Bar, displaying several types of values. Each type of result is displayed in a different way.
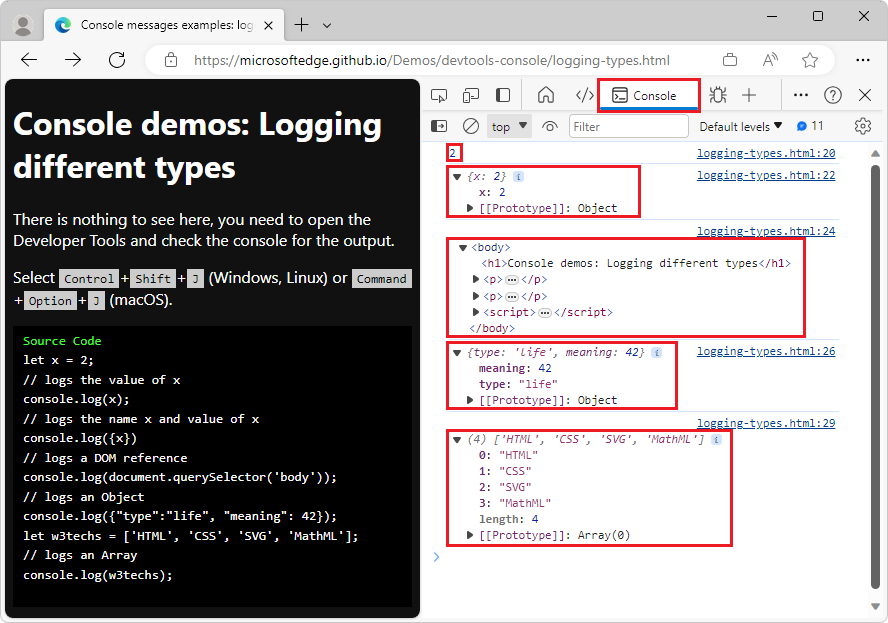
Expand each output entry to analyze each result in more detail.
The second log message in the example code uses curly braces
{}around thexvariable, to output the name of the variable in addition to the value of the variable. This syntax logs an object that contains a single property namedx, instead of logging the value ofxonly.Logging variables of different types in the Console:
Logging variables of different types in the Console with expanded, extra information:
Copy and paste any of the examples from the rendered webpage into the Console, such as
console.log({x}), and then press Enter.Formatted output is displayed in the Console, below the code that you entered.
Logging values using format specifiers
A feature of all the log methods is that you can use format specifiers in your log statement's message. Format specifiers are part of a log message, and start with a percentage sign (%) character.
Use format specifiers to log certain values in different formats, and to convert between formats:
%slogs output as Strings.%ior%dlogs output as Integers.%flogs output as a floating-point value.%ologs output as an expandable DOM element.%Ologs output as an expandable JavaScript object.%callows you to style a message by using CSS properties.
Example code for logging values using format specifiers
// logs "10x console developer"
console.log('%ix %s developer', 10, 'console');

// logs PI => 3.141592653589793
console.log(Math.PI);

// logs PI as an integer = 3
console.log('%i', Math.PI);

// logs the document body as a DOM node
console.log('%o', document.body);

// logs the body of the document as a JavaScript object with all properties
console.log('%O', document.body);

// shows the message as red and big
console.log('%cImportant message follows','color:red;font-size:40px')
Demo webpage for logging values using format specifiers
Open the demo page Console messages examples: Logging with specifiers in a new tab or window.
Press Ctrl+Shift+J (Windows, Linux) or Command+Option+J (macOS).
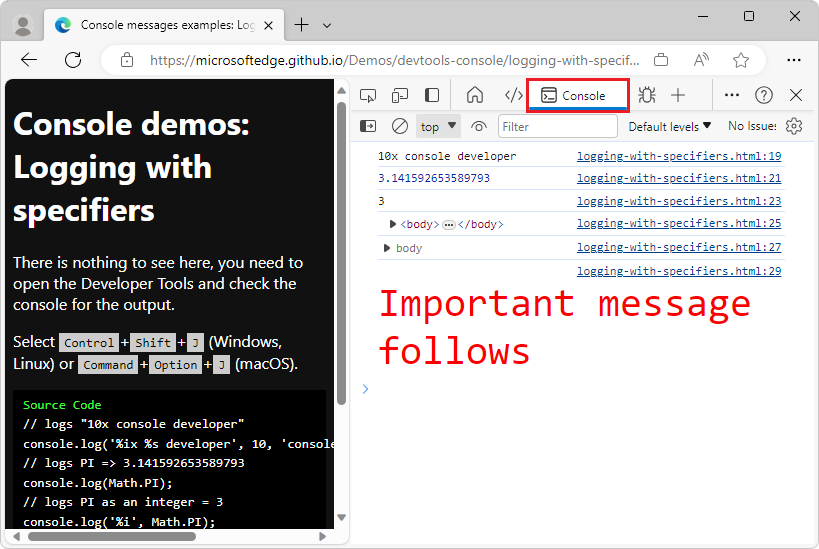
DevTools opens, with the Console open in the Activity Bar. The webpage has already populated the Console with output.
The first example demonstrates that the order of replacement of format specifiers is the parameter order following the string:
console.log('%ix %s developer', 10, 'console'); // logs "10x console developer"Click the expander triangles in the output results, to expand the data that's output by the above
logstatements that are in the webpage.If necessary, press F5 to reload the page and re-populate the Console output.
Format specifiers are used to log, format, and convert values:
In the Console, on the two
bodyentries, click the triangles to expand the log results, to see the difference between the%oand%Oformat specifiers.The
bodyelement of the webpage is either displayed as an expandable DOM node (console.log('%o', document.body);), or as a full list of all JavaScript properties on thebodyelement (console.log('%O', document.body);):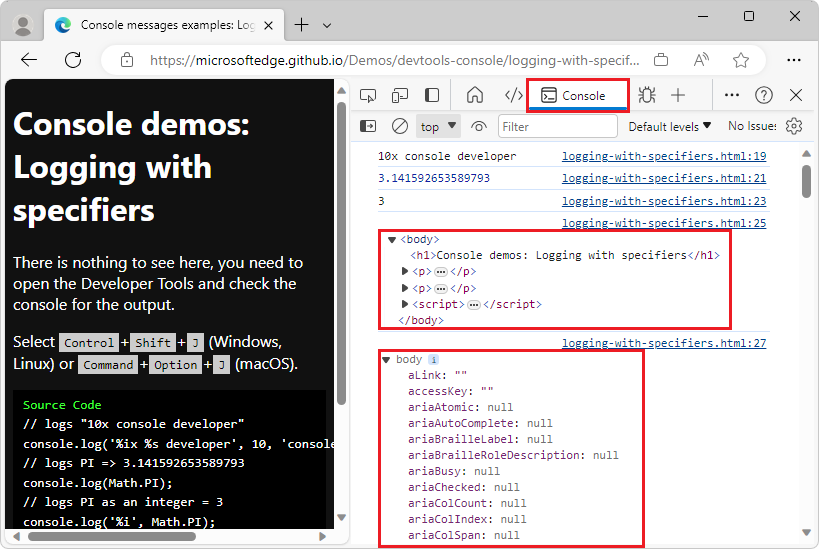
Grouping log messages
If you log a lot of information, you can use the group and groupCollapsed methods to display log messages as expandable and collapsible groups in the Console. Groups can be nested and named, to make the data easier to understand.
Example code for grouping log messages
// Example 1: Nested groups, with the inner group hidden (collapsed):
console.group("Passengers: Heart of Gold");
console.log('Zaphod');
console.log('Trillian');
console.log('Ford');
console.log('Arthur');
console.log('Marvin');
console.groupCollapsed("Hidden");
console.log('(Frankie & Benjy)');
console.groupEnd();
console.groupEnd();


// Example 2:
let technologies = {
  "Standards": ["HTML", "CSS", "SVG", "ECMAScript"],
  "Others": ["jQuery", "Markdown", "Textile", "Sass", "Pug"]
}
for (tech in technologies) {
  console.groupCollapsed(tech);
  technologies[tech].forEach(t => console.log(t));
  console.groupEnd();
}
Demo webpage for grouping log messages
Open the demo page Console messages examples: Grouping logs in a new tab or window.
Press Ctrl+Shift+J (Windows, Linux) or Command+Option+J (macOS).
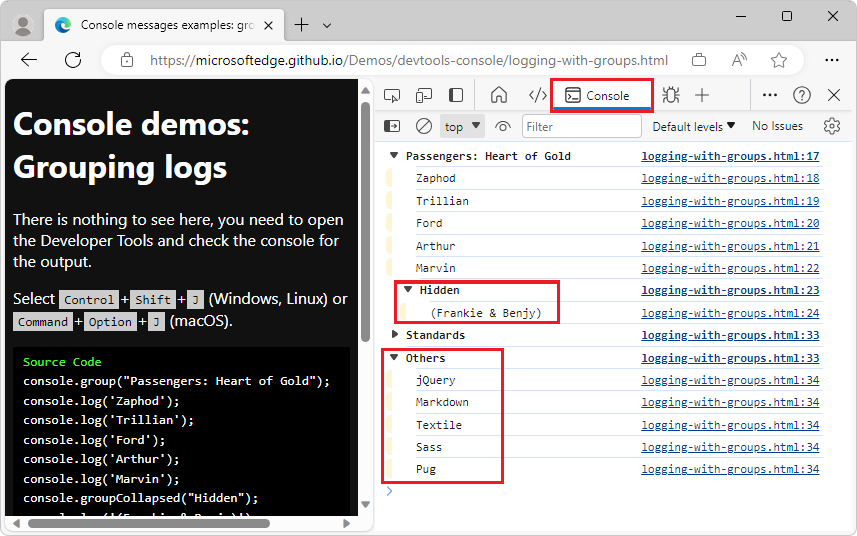
DevTools opens, with the Console open in the Activity Bar. The webpage has already populated the Console with output, logging many values as groups:
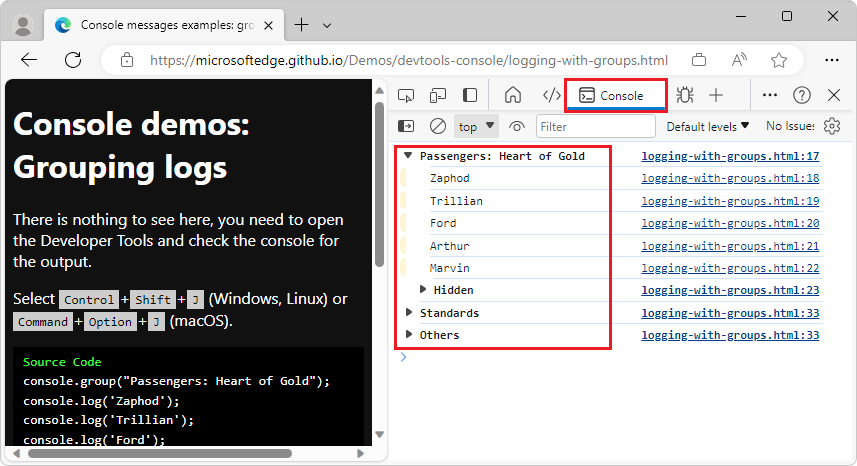
In the Console output, expand or collapse the sections:
Displaying data as tables
As an alternative to outputting expandable objects, the console.table() method logs data as a table that you can sort by using the table headers, to make it easier to view the information.
Example code for displaying complex data as tables
let technologies = {
  "Standards": ["HTML", "CSS", "SVG", "ECMAScript"],
  "Others": ["jQuery", "Markdown", "Textile", "Sass", "Pug"]
}
// log technologies as an object
console.log(technologies);
// show technologies as a table
console.table(technologies);

// get the dimensions of the document body
let bodyDimensions = document.body.getBoundingClientRect();
// show dimensions as an object
console.log(bodyDimensions);
// show dimensions as a table
console.table(bodyDimensions);
This code in the demo webpage produces the first four console outputs, with four line numbers shown on the right side of the Console.
Demo webpage for displaying complex data as tables
To show complex data as tables:
Open the demo page Console messages examples: Using table in a new window or tab.
Press Ctrl+Shift+J (Windows, Linux) or Command+Option+J (macOS).
DevTools opens, with the Console open in the Activity Bar. The webpage has already populated the Console with output.
In the Console, click the expander triangles.
The data is output by using
console.table, which makes the data easier to read: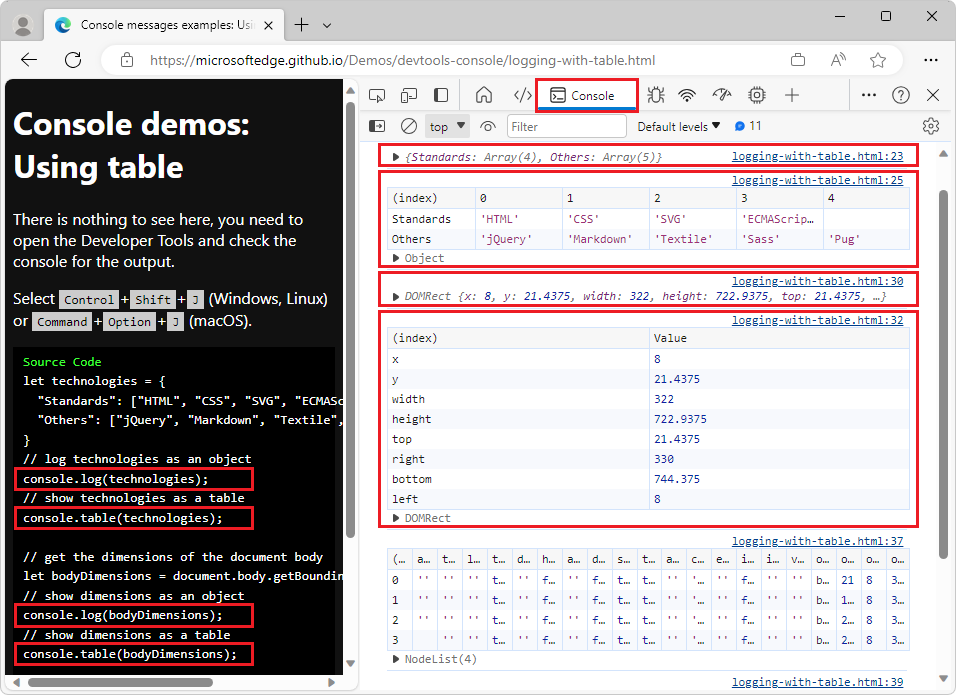
The output of console.table has a table format. If you copy and paste a table from the Console into an app that supports tabular data, such as Microsoft Excel or Microsoft Word, the structuring of the output as rows and columns is preserved.
Specifying an array of properties to display as columns
If the data has named parameters, the console.table() method also allows you to specify an Array of columns for each property to display as a second parameter. The following example shows how to specify an array of columns that is more readable:
The remaining code in the demo webpage shows:
- How to output all the properties as columns, for the selected elements.
- How to specify an array only of specified properties as columns, for the selected elements.
// get all the h1, p and script elements
let contentElements = document.querySelectorAll(':is(h1,p,script)');
// show the elements as an unfiltered table
console.table(contentElements)
// show only relevant columns
console.table(contentElements, ['nodeName', 'innerText', 'offsetHeight'])
This code produces the final two console outputs, with two line numbers shown on the right side of the Console:
logging-with-table.html:37logging-with-table.html:39
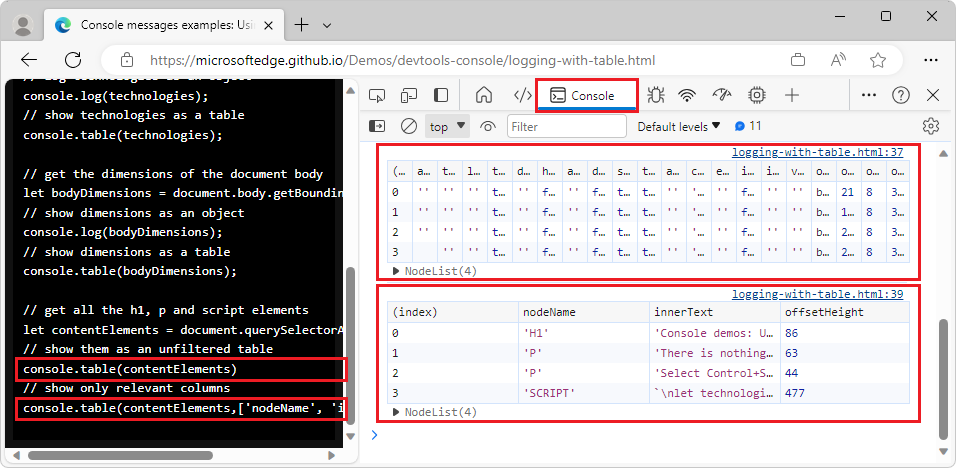
The final call to console.table filters the information that the console.table() method displays, by specifying an array of properties to display, as a second parameter.
Log statements vs. breakpoint debugging and Live Expressions
You might be tempted to use the log methods as your main means to debug webpages, because log methods are simple to use. However, consider the result of any console.log() request: released products shouldn't use any log statement that was used for debugging, because it could reveal inside information to people. And excess noise is created in the Console.
So, instead of log statements, try using Breakpoint Debugging or Live Expressions. You may find that your workflows are more effective and you get better results.