Note
Access to this page requires authorization. You can try signing in or changing directories.
Access to this page requires authorization. You can try changing directories.
The Coverage tool helps you find unused JavaScript and CSS code. Removing unused code can speed up your page load and save your mobile users cellular data.
This guide covers how to find unused code by using the Coverage tool. This guide doesn't cover how to refactor a codebase to avoid unused code, because refactoring code depends on your technology stack.
Overview
Shipping unused JavaScript or CSS is a common problem in web development. For example, suppose that you want to use the Bootstrap button component on your page. To use the button component, you need to add a link to the Bootstrap stylesheet in your HTML, like this:
<html>
  <head>
    <link rel="stylesheet" href="https://cdn.jsdelivr.net/npm/bootstrap@5.3.2/dist/css/bootstrap.min.css">
  </head>
  <body>
    <button class="btn btn-primary">Button</button>
  </body>
</html>
This stylesheet doesn't just include the code for the Bootstrap button component; it contains the CSS for all of the Bootstrap components. Because your page only uses the button component, you're making users download extra code that they don't need. The Coverage tool helps you find unused code such as this.
Open the Coverage tool
To find unused code in your page, use the Coverage tool:
To open DevTools, right-click the webpage, and then select Inspect. Or, press Ctrl+Shift+I (Windows, Linux) or Command+Option+I (macOS). DevTools opens.
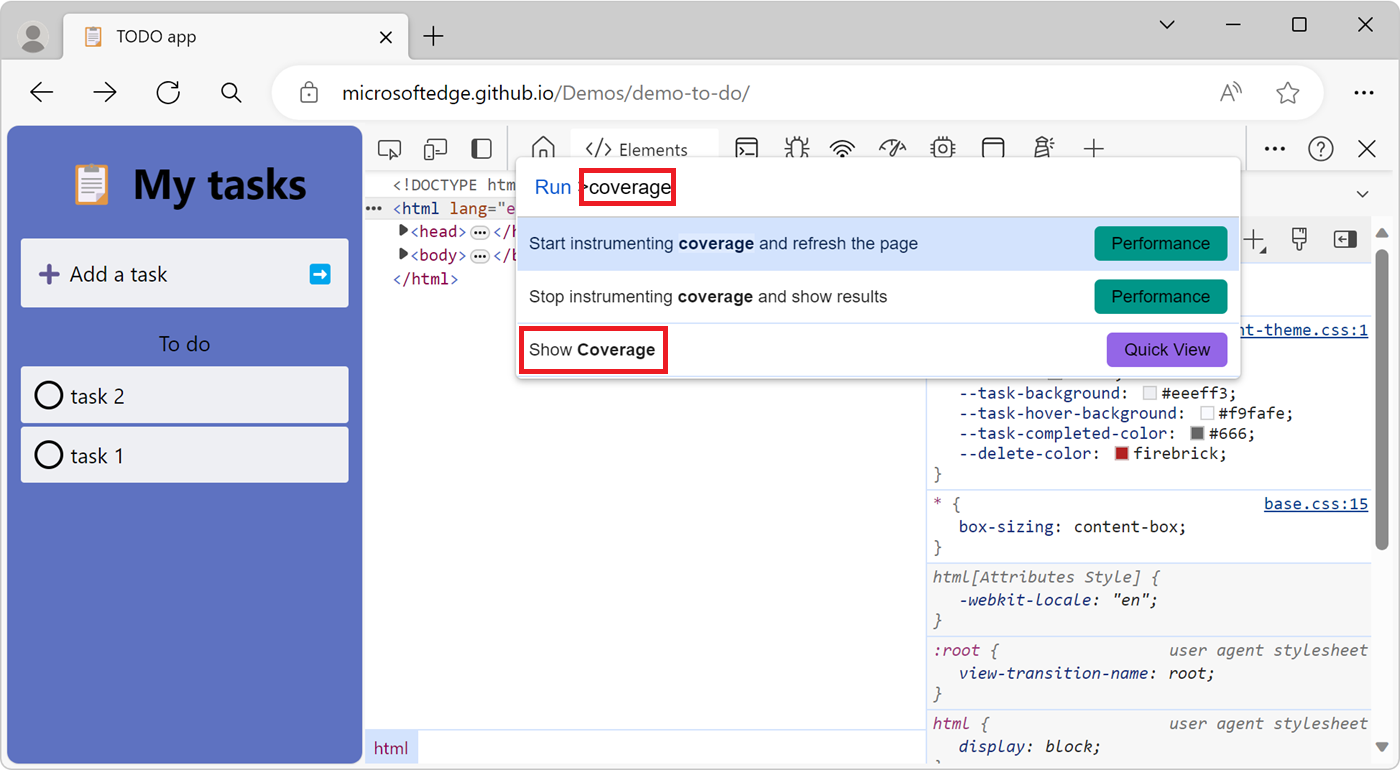
In DevTools, open the Command Menu. To open the Command Menu, press Ctrl+Shift+P (Windows, Linux) or Command+Shift+P (macOS).
Start typing coverage, press the Down Arrow key to highlight the Show Coverage command, and then press Enter:
The Coverage tool opens in the Quick View panel at the bottom of DevTools:
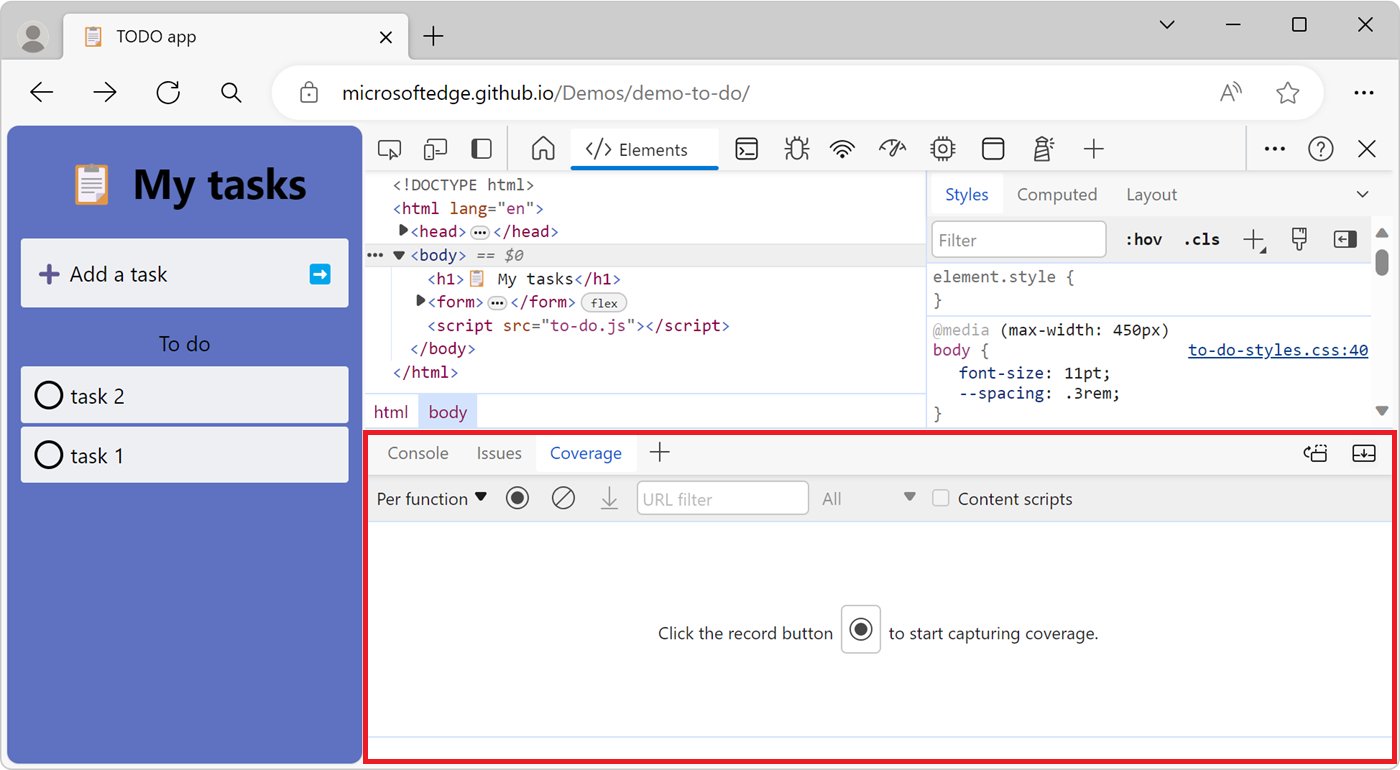
Record code coverage
Click one of the following buttons in the Coverage tool:
To see what code is needed to load the page, click the Start instrumenting coverage and refresh the page (
 ) button.
To see what code is used after interacting with the page, click the Instrument coverage (
 ) button.
To stop recording code coverage, click the Stop instrumenting coverage and show results (
 ) button.
Analyze code coverage
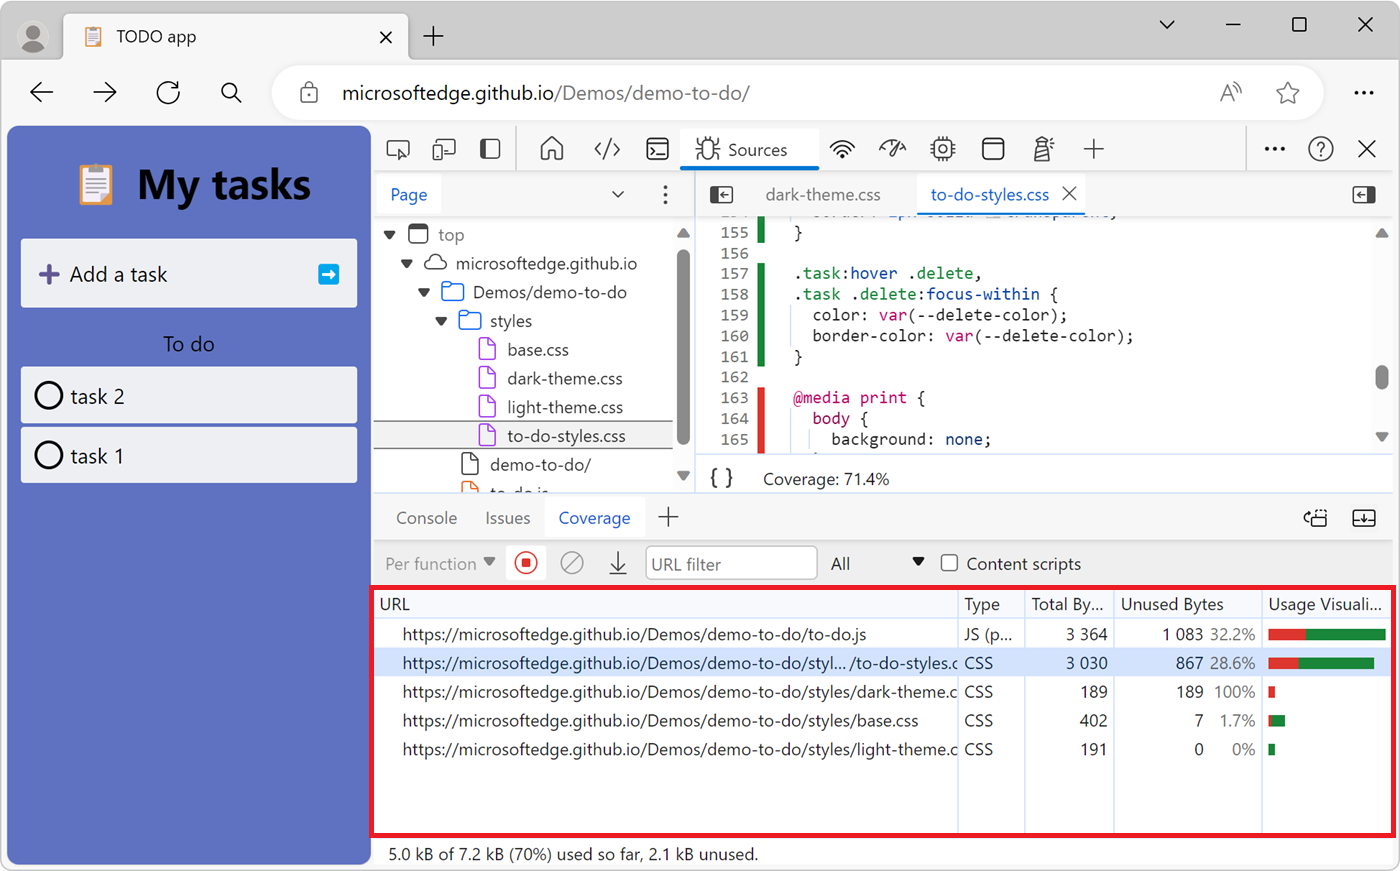
The table in the Coverage tool displays the resources that were analyzed, and how much code is used within each resource. Click a row to open that resource in the Sources tool and display a code coverage report that gives a line-by-line breakdown of used code and unused code:
Columns in the code coverage report:
| Column | Description |
|---|---|
| URL | The URL of the resource that was analyzed. |
| Type | Whether the resource contains CSS, JavaScript, or both. |
| Total Bytes | The total size of the resource in bytes. |
| Unused Bytes | The number of bytes that weren't used. |
| Usage Visualization | A visualization of the Total Bytes and Unused Bytes columns. The green section of the bar is used bytes. The red section of the bar is unused bytes. |
Note
Portions of this page are modifications based on work created and shared by Google and used according to terms described in the Creative Commons Attribution 4.0 International License. The original page is found here and is authored by Kayce Basques.
![]() This work is licensed under a Creative Commons Attribution 4.0 International License.
This work is licensed under a Creative Commons Attribution 4.0 International License.