Note
Access to this page requires authorization. You can try signing in or changing directories.
Access to this page requires authorization. You can try changing directories.
The Performance and Memory tools record runtime data about your webpage. Exploring the recorded data makes it possible to improve your webpage's memory usage or runtime performance.
Additionally, the recorded data can be exported to files on disk. The exported files are called traces.
Exporting performance and memory traces is useful when you want to share these files with other people to get help with investigating issues. An exported trace is a .json, .heapsnapshot, .heapprofile, or .heaptimeline file which can be imported in DevTools at any time.
By default, traces contain minimal information about the runtime data from the traced webpage, but traces can also be exported as enhanced traces, as an experimental feature. An enhanced trace is a .devtools file which contains much more runtime data from the traced webpage. Enhanced traces make it easier to resolve performance and memory issues, by recreating the environment in which the trace was recorded, and by providing original source files.
Using enhanced traces makes it possible to reliably resolve source code references found in imported traces to the actual runtime code in the Sources tool. Additionally, if source maps were present when a trace was recorded, or if they are stored on the Azure Artifacts Symbol Server, it will also be possible to resolve code references to their original source code.
Differences between normal and enhanced traces
Normal traces
A normal trace only contains some of the information that's present in a webpage. Much of the original code is lost and only the recorded performance or memory data of the webpage is preserved in the trace. For example, when importing a .heapsnapshot memory trace that was recorded during another DevTools session or on another computer, there's no way to go from an object in the Memory tool to its constructor in the Sources tool.
Similarly, in the Performance tool, when you import a performance trace recorded earlier:
- The trace needs to have been recorded on the same site and same configuration to be able to map from the performance report to the JavaScript that was running in the browser.
- If file or function names have changed since the recording was taken, the mapping is prone to errors.
Enhanced traces
An enhanced trace retains much more information about the webpage where the recording took place. For example, an enhanced trace contains the execution context and the list of parsed scripts, and can optionally contain console messages, script sources, and a snapshot of the DOM tree.
When an enhanced trace is imported in DevTools, a new DevTools window appears. This new window isn't connected to the webpage that's running in your browser, and instead re-creates part of the environment in which the trace was originally recorded.
For example, if a snapshot of the DOM was recorded in the enhanced trace, the Elements tool displays this snapshot. If console messages were recorded, the Console tool prints these messages. The Sources tool displays the scripts that were present during the recording.
Enhanced traces can only be imported in Microsoft Edge, while normal traces are compatible with other browsers based on the Chromium engine.
Set the default trace type
By default, the Performance and Memory tools export data as normal traces, but you can set the default trace type to enhanced.
To change the trace type:
Open DevTools by pressing Ctrl+Shift+I (Windows, Linux) or Command+Option+I (macOS).
In DevTools, in the upper right, click Settings (
 ). Settings opens, with the Preferences page selected.
In the Persistence section of the Preferences page, select the Export enhanced performance and memory traces checkbox:
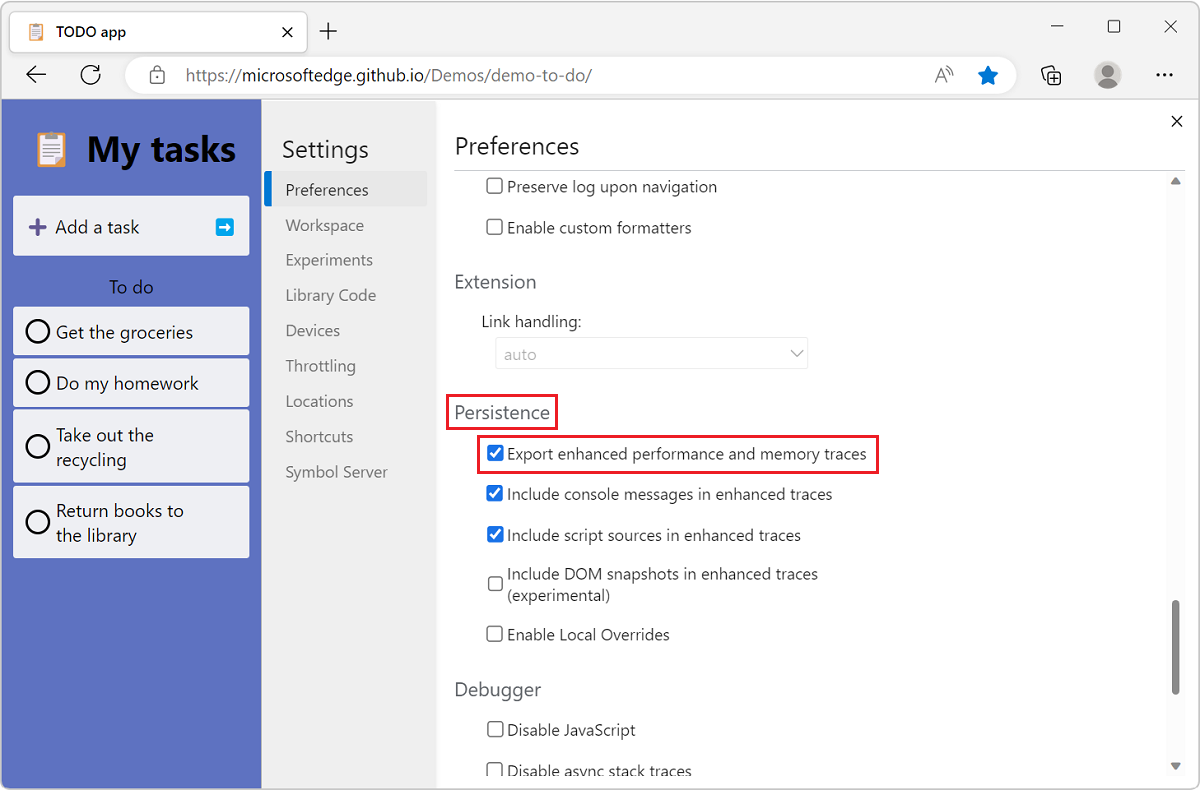
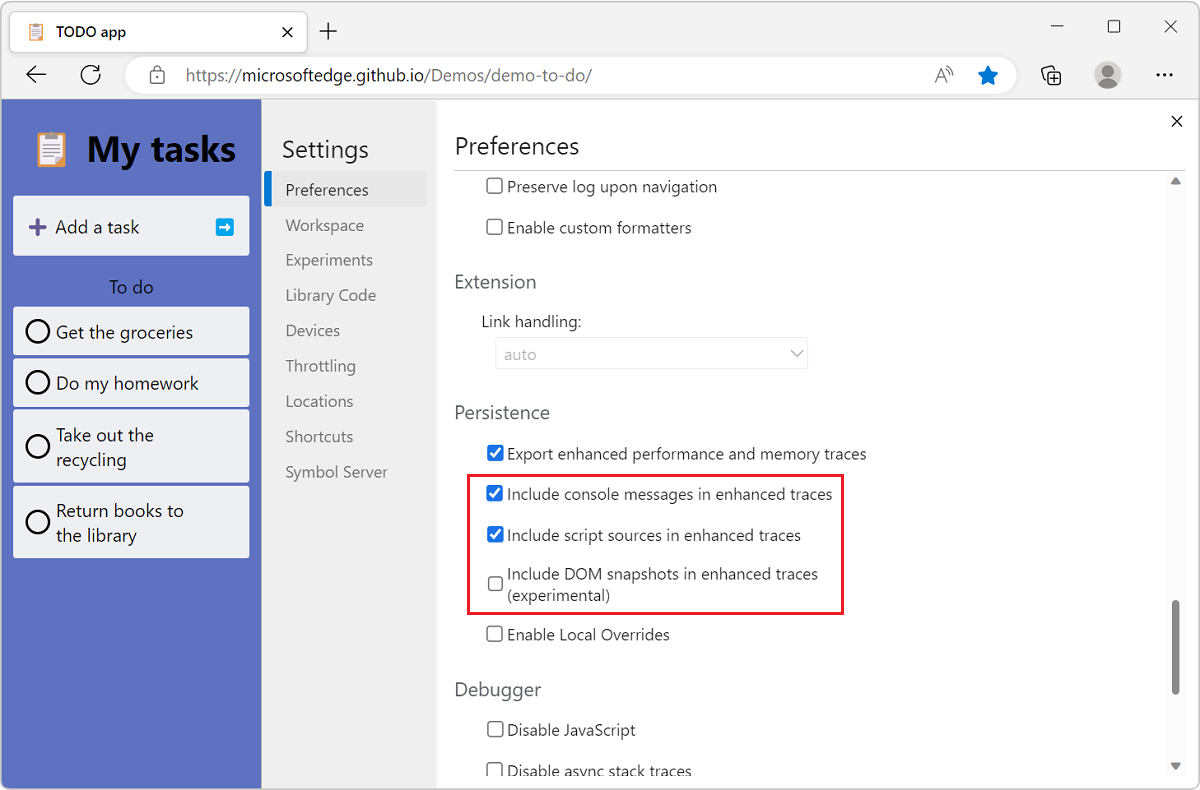
Enhanced traces can also optionally include console messages, script sources, and DOM elements. To control what to include in enhanced traces, use these checkboxes:
- Include console message in enhanced traces.
- Include script sources in enhanced traces.
- Include DOM snapshots in enhanced traces (experimental).
Export a trace from the Performance tool
To export a performance recording from the Performance tool:
Open the Performance tool.
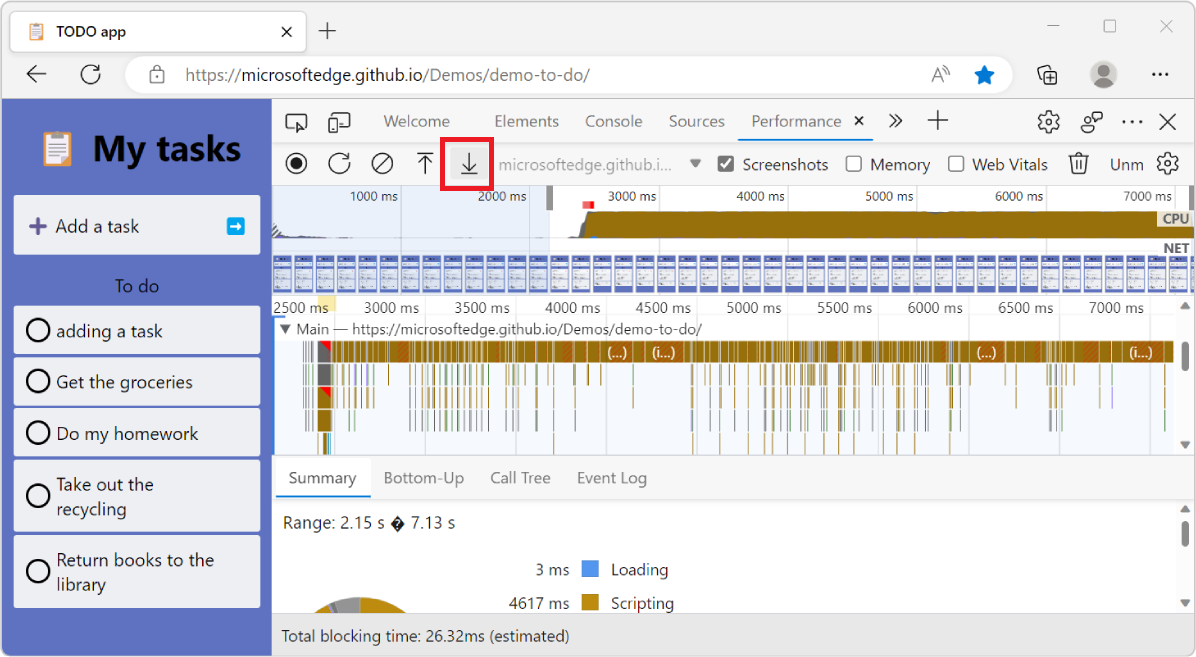
Click Record and run the scenario you want to investigate the performance of by interacting with the webpage, and then click Stop.
When the performance profile appears, click Save profile (
 ):
):
Choose a location to save the trace file on your disk:
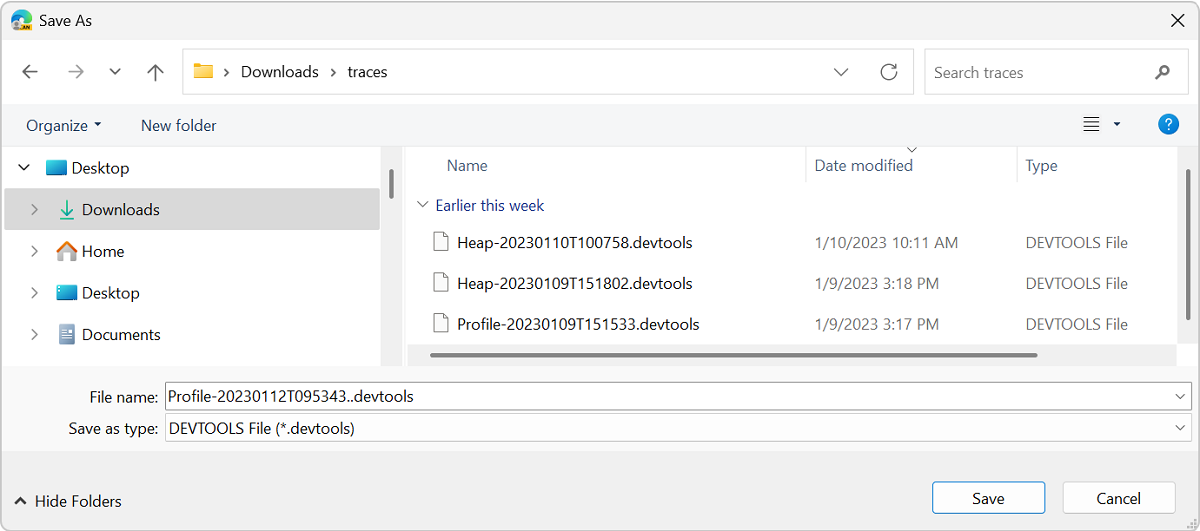
The trace is a
.jsonfile if you set the default trace type to normal, and it is a.devtoolsfile if you set the default trace type to enhanced.
Export a trace from the Memory tool
To export memory information from the Memory tool:
Open the Memory tool.
Choose the type of memory recording you're interested in, such as Heap Snapshot. The following instructions are similar if you choose a different memory recording type. To learn more about the different memory recording types, see Fix memory problems.
Click Take Snapshot.
When the snapshot is recorded, click the Save button in the Memory tool sidebar:
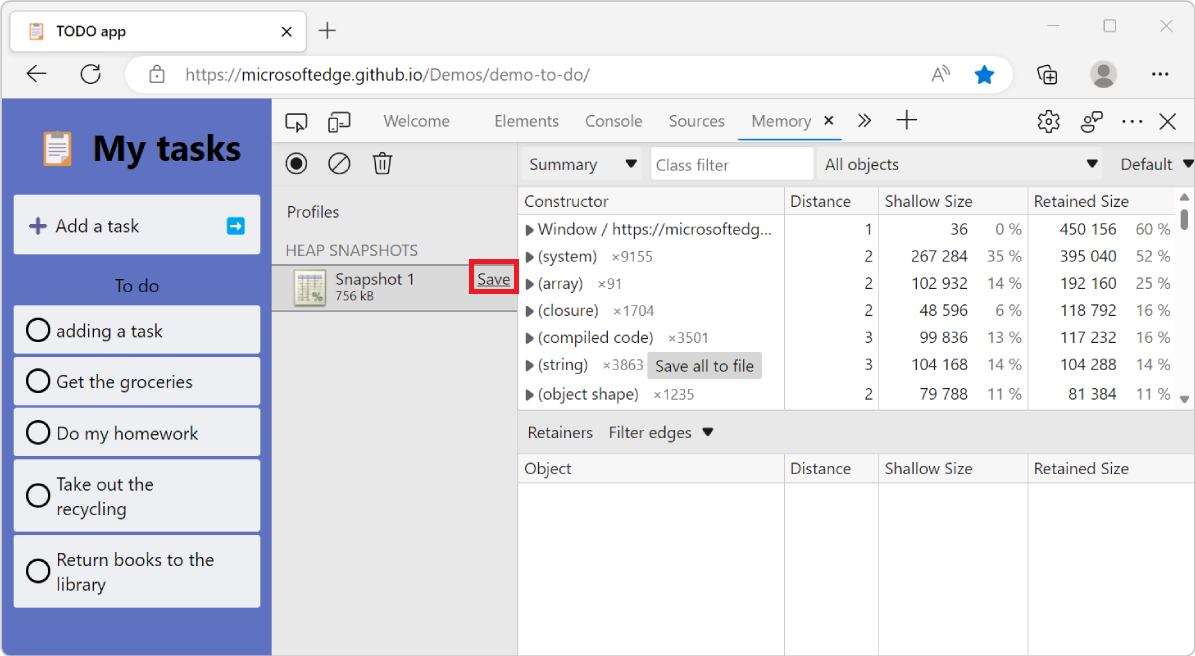
Choose a location to save the trace file on your disk:
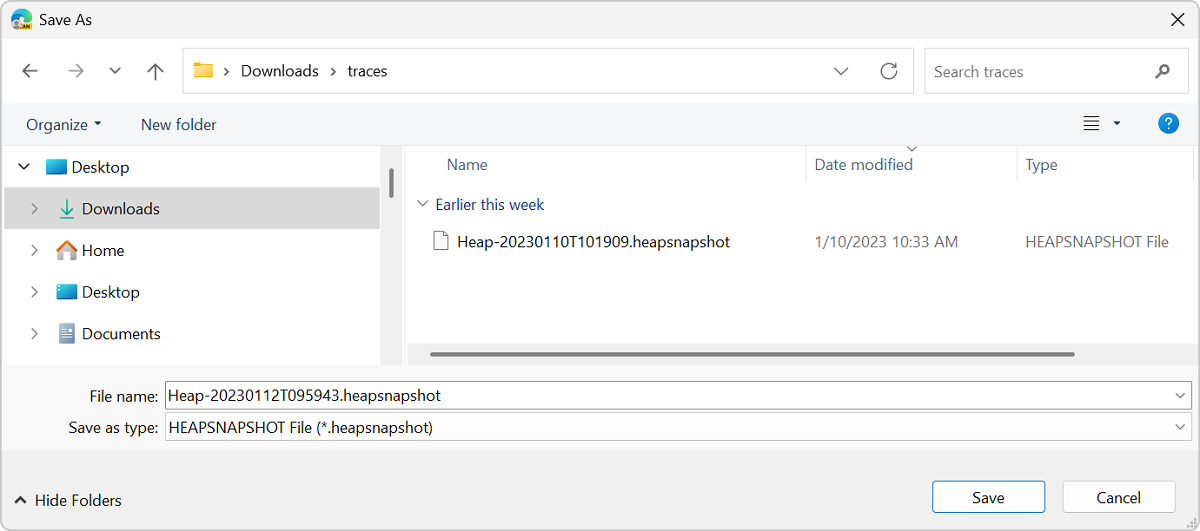
The trace is a
.heapsnapshot,.heapprofile, or.heaptimelinefile if you set the default trace type to normal, and it is a.devtoolsfile if you set the default trace type to enhanced.
Choose a trace type when exporting
Traces are exported as normal or enhanced traces, depending on the Export Enhanced Performance and Memory Traces option. To change the default trace type, see Set the default trace type. You can also choose the type of trace you want when exporting.
To choose a different trace type when exporting:
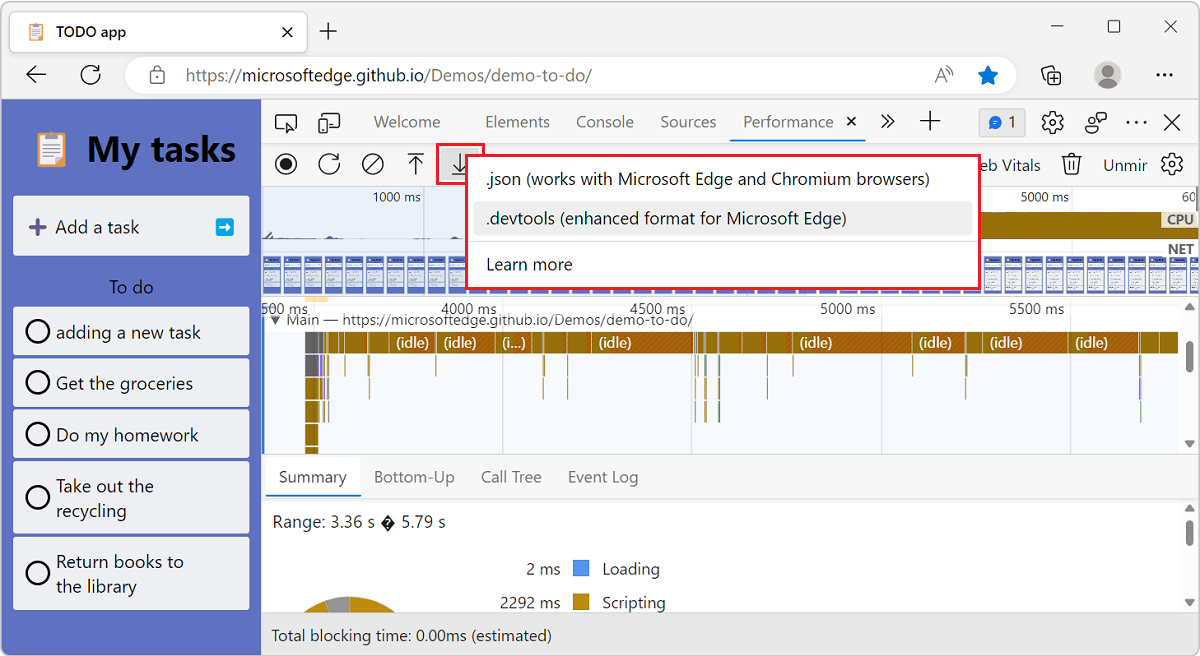
Right-click (or hold the Ctrl key and click) the Save profile (
) in the Performance tool or the Save button in the Memory tool.Click either .devtools (enhanced format for Microsoft Edge) if you want to export an enhanced trace, or click .json (works with Microsoft Edge and Chromium browsers) if you want a normal trace.
Import a trace in the Performance tool
To import a trace in the Performance tool:
Open the Performance tool.
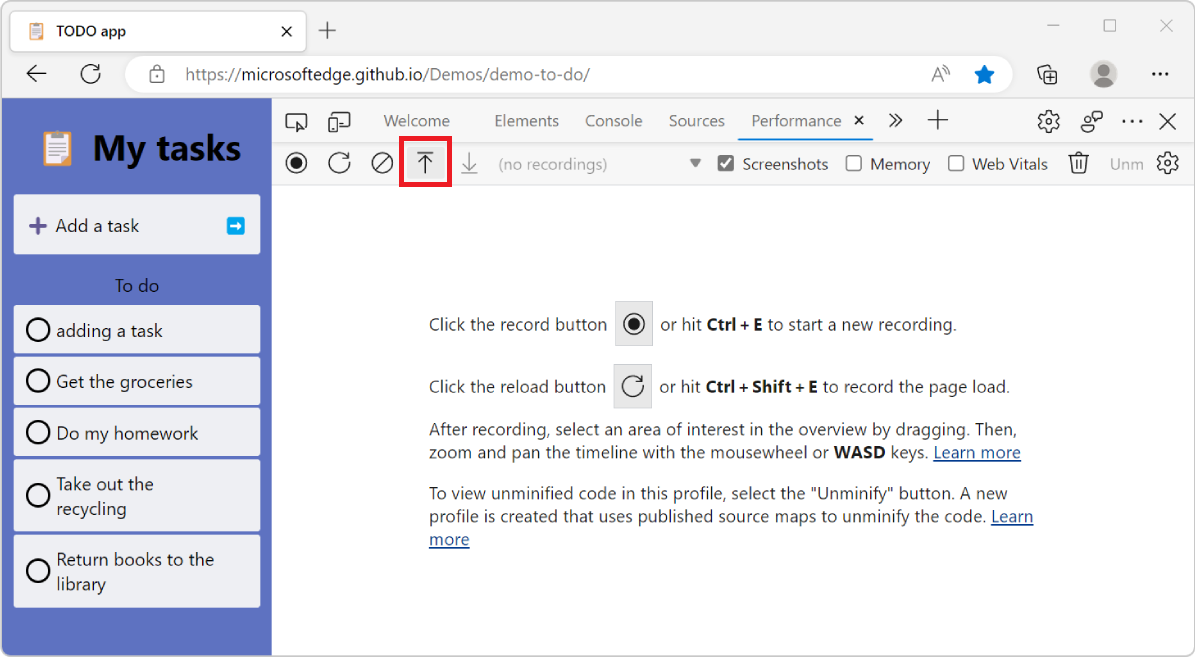
Click Load profile (
 ):
):
Locate the trace file on your disk. It's either a
.devtoolsfile (for enhanced traces) or a.jsonfile (for normal traces):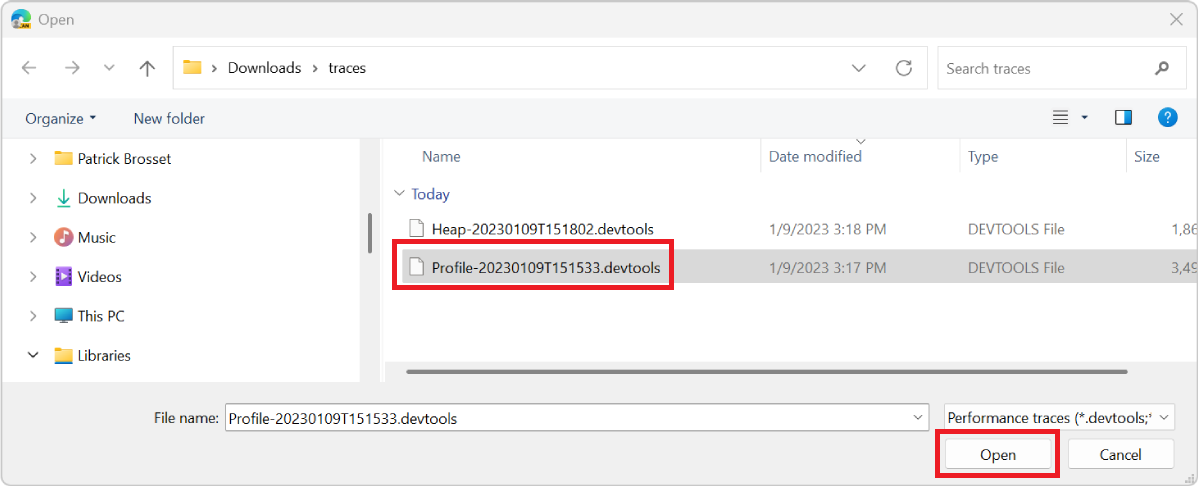
Open the file.
If the file is an enhanced trace, a new DevTools window appears, showing the performance profile and the extra runtime information that was recorded displayed in the Sources, Console, and Elements tools.
If the file is a normal trace, the performance profile appears in the Performance tool, and the rest of the DevTools tabs continue to show information related to the current webpage.
Import a trace in the Memory tool
To import a trace in the Memory tool:
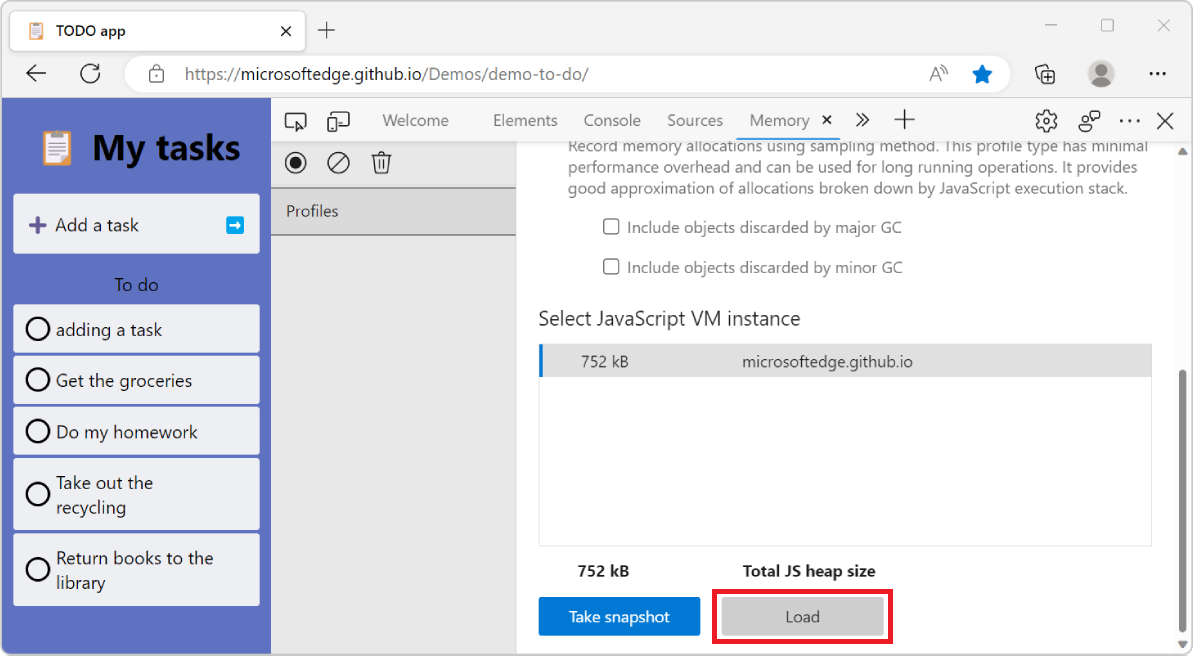
Open the Memory tool.
Click the Load profile button:
Locate the trace file on your disk. It's either a
.devtoolsfile (for enhanced traces) or a.heapsnapshot,.heaptimeline, or.heapprofilefile (for normal traces).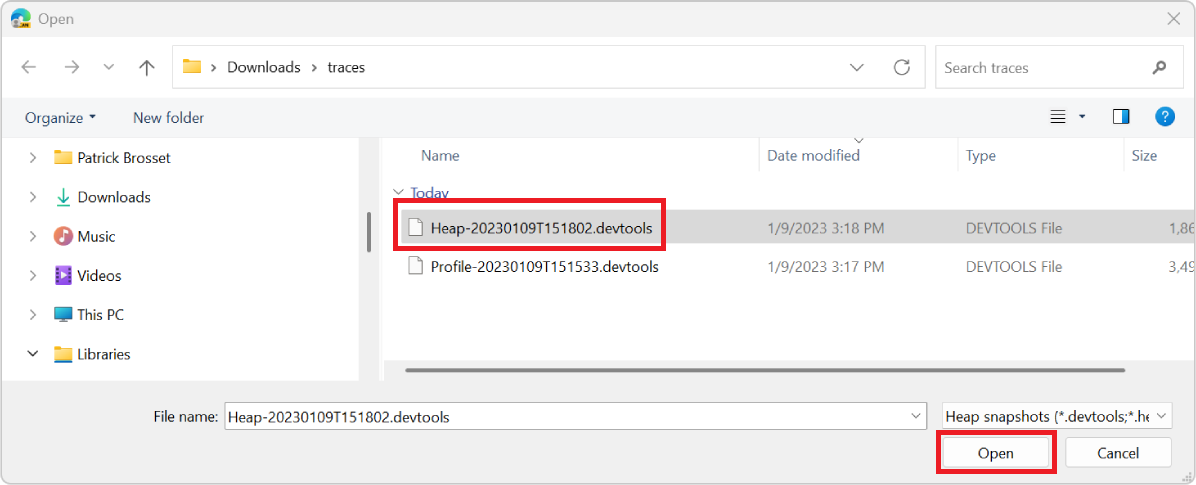
Open the file.
If the file is an enhanced trace, a new DevTools window appears, showing the memory information and the extra runtime information that was recorded displayed in the Sources, Console, and Elements tools.
If the file is a normal trace, the memory information appears in the Memory tool, and the rest of the DevTools tabs continue to show information related to the current webpage.
Share feedback about enhanced traces
Enhanced traces is an experimental feature which hopefully makes it easier to collaborate on resolving performance and memory issues by seeing unminified code.
The Microsoft Edge DevTools team welcomes any feedback you may have about enhanced traces. If you've tried this new feature, please feel free to report any problems or ideas about it on our GitHub repository.