Note
Access to this page requires authorization. You can try signing in or changing directories.
Access to this page requires authorization. You can try changing directories.
Use the Performance monitor tool to get a real-time view of the runtime performance of a webpage.
The Performance monitor tool helps determine where performance problems come from. There are various reasons why a website might run slowly. This tool provides clues to understand whether the problems are related to causes such as the following:
- High memory or CPU usage.
- Too frequent layout and style calculations.
- Too many DOM nodes and event listeners.
Open the Performance monitor tool
To open the Performance monitor tool:
To open DevTools, right-click the webpage, and then select Inspect. Or, press Ctrl+Shift+I (Windows, Linux) or Command+Option+I (macOS). DevTools opens.
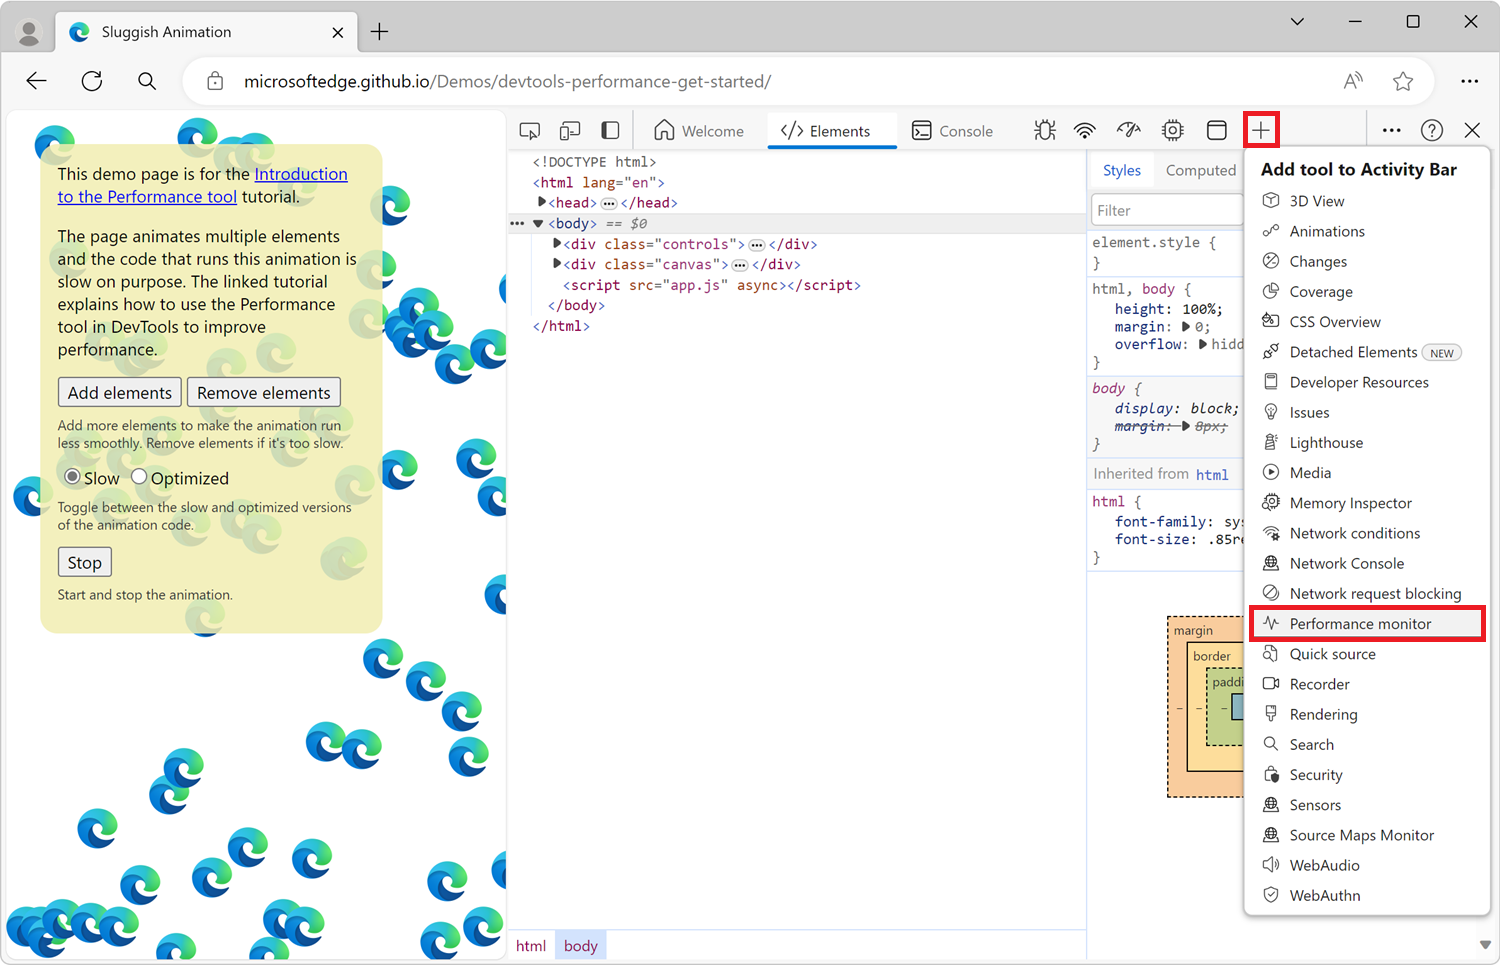
In DevTools, on the Activity Bar, select the Performance monitor tab. If that tab isn't visible, click the More Tools (
 ) button:
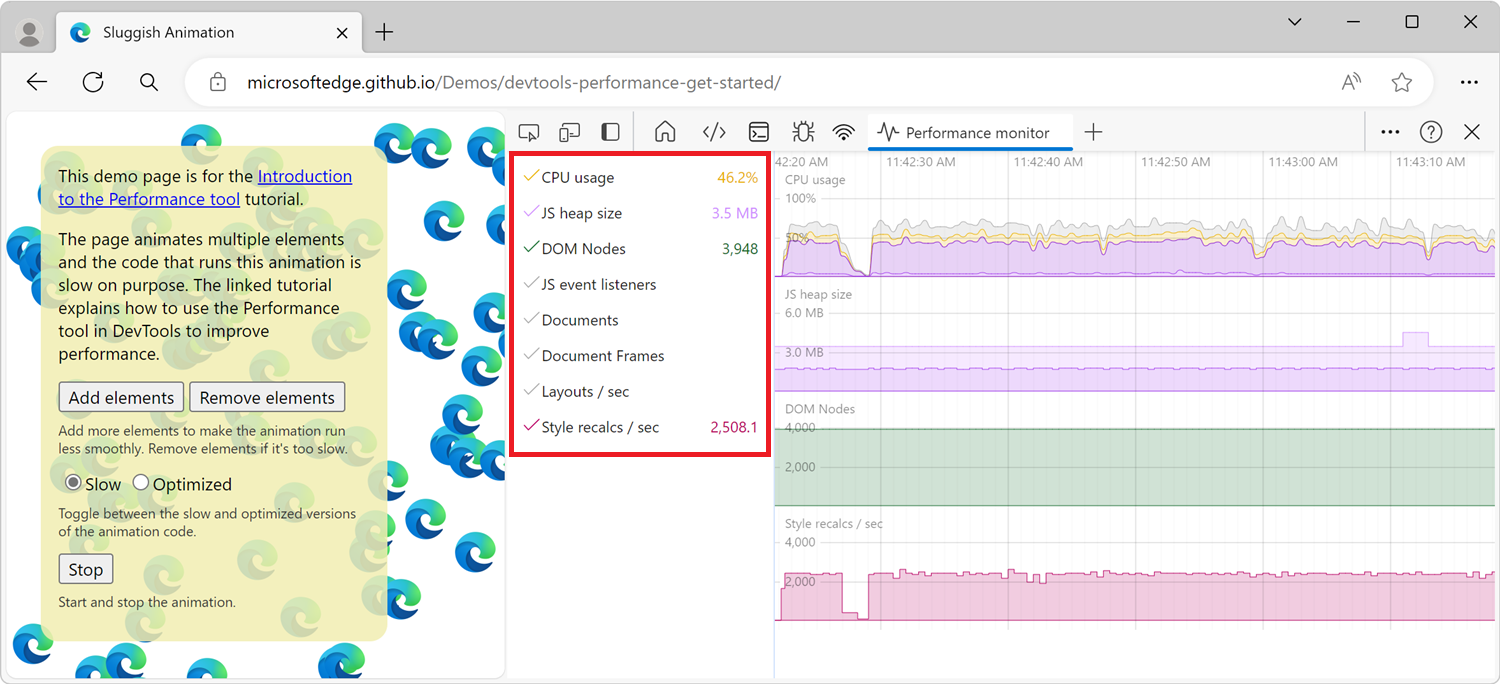
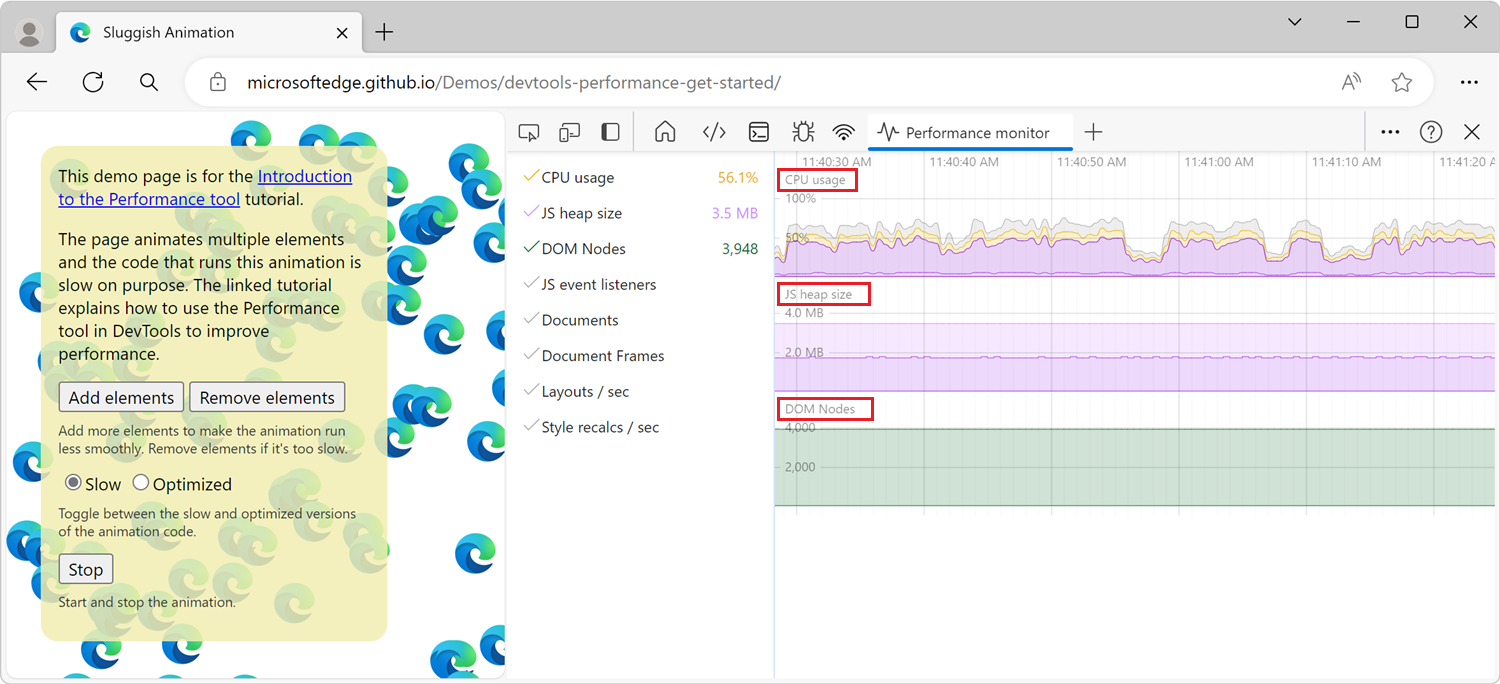
The Performance monitor shows graphs of various performance metrics that update in real time:
Select performance metrics to monitor
The Performance monitor tool shows three performance metrics by default, and additional metrics are available.
| Performance metric | Description |
|---|---|
| CPU usage | The percentage of CPU used by the web page. Shown by default. |
| JS heap size | The amount of memory used by the JavaScript program on the page. Shown by default. |
| DOM Nodes | The number of DOM nodes in the browser (across tabs). Shown by default. |
| JS event listeners | The number of JavaScript event listeners in the browser (across tabs). |
| Documents | The number of document objects in the browser (across tabs). |
| Document Frames | The number of document frames in the browser (across tabs). |
| Layouts / sec | The number of times per second the browser engine constructs the layout of the page. |
| Style recalcs / sec | The number of times per second the browser engine calculates the CSS style of the page. |
To enable or disable any of the available performance metrics, click the labels in the sidebar: