Note
Access to this page requires authorization. You can try signing in or changing directories.
Access to this page requires authorization. You can try changing directories.
Remote debug live content on a Windows 10 or later device from your Windows or macOS computer.
This tutorial teaches you the following tasks:
Set up your Windows device for remote debugging and connect to it from your development machine.
Inspect and debug live content on your Windows device from your development machine.
Screencast content from your Windows device onto a DevTools instance on your development machine.
Step 1: Set up the host (debuggee machine)
The host or debuggee machine is the Windows 10 or later device that you want to debug. It may be a remote device that is hard for you to physically access or it may not have keyboard and mouse peripherals, making it difficult to interact with the Microsoft Edge DevTools on that device.
To set up the host (debuggee) machine, use the following sub-sections, in order.
Install and configure Microsoft Edge
If not already installed, on the Windows 10 or later device that you want to debug, install Microsoft Edge, from Get to Know Microsoft Edge.
If you're using a pre-installed version of Microsoft Edge on the host (debuggee) machine, verify that you have Microsoft Edge (Chromium) and not Microsoft Edge (EdgeHTML). A quick way to check is to load
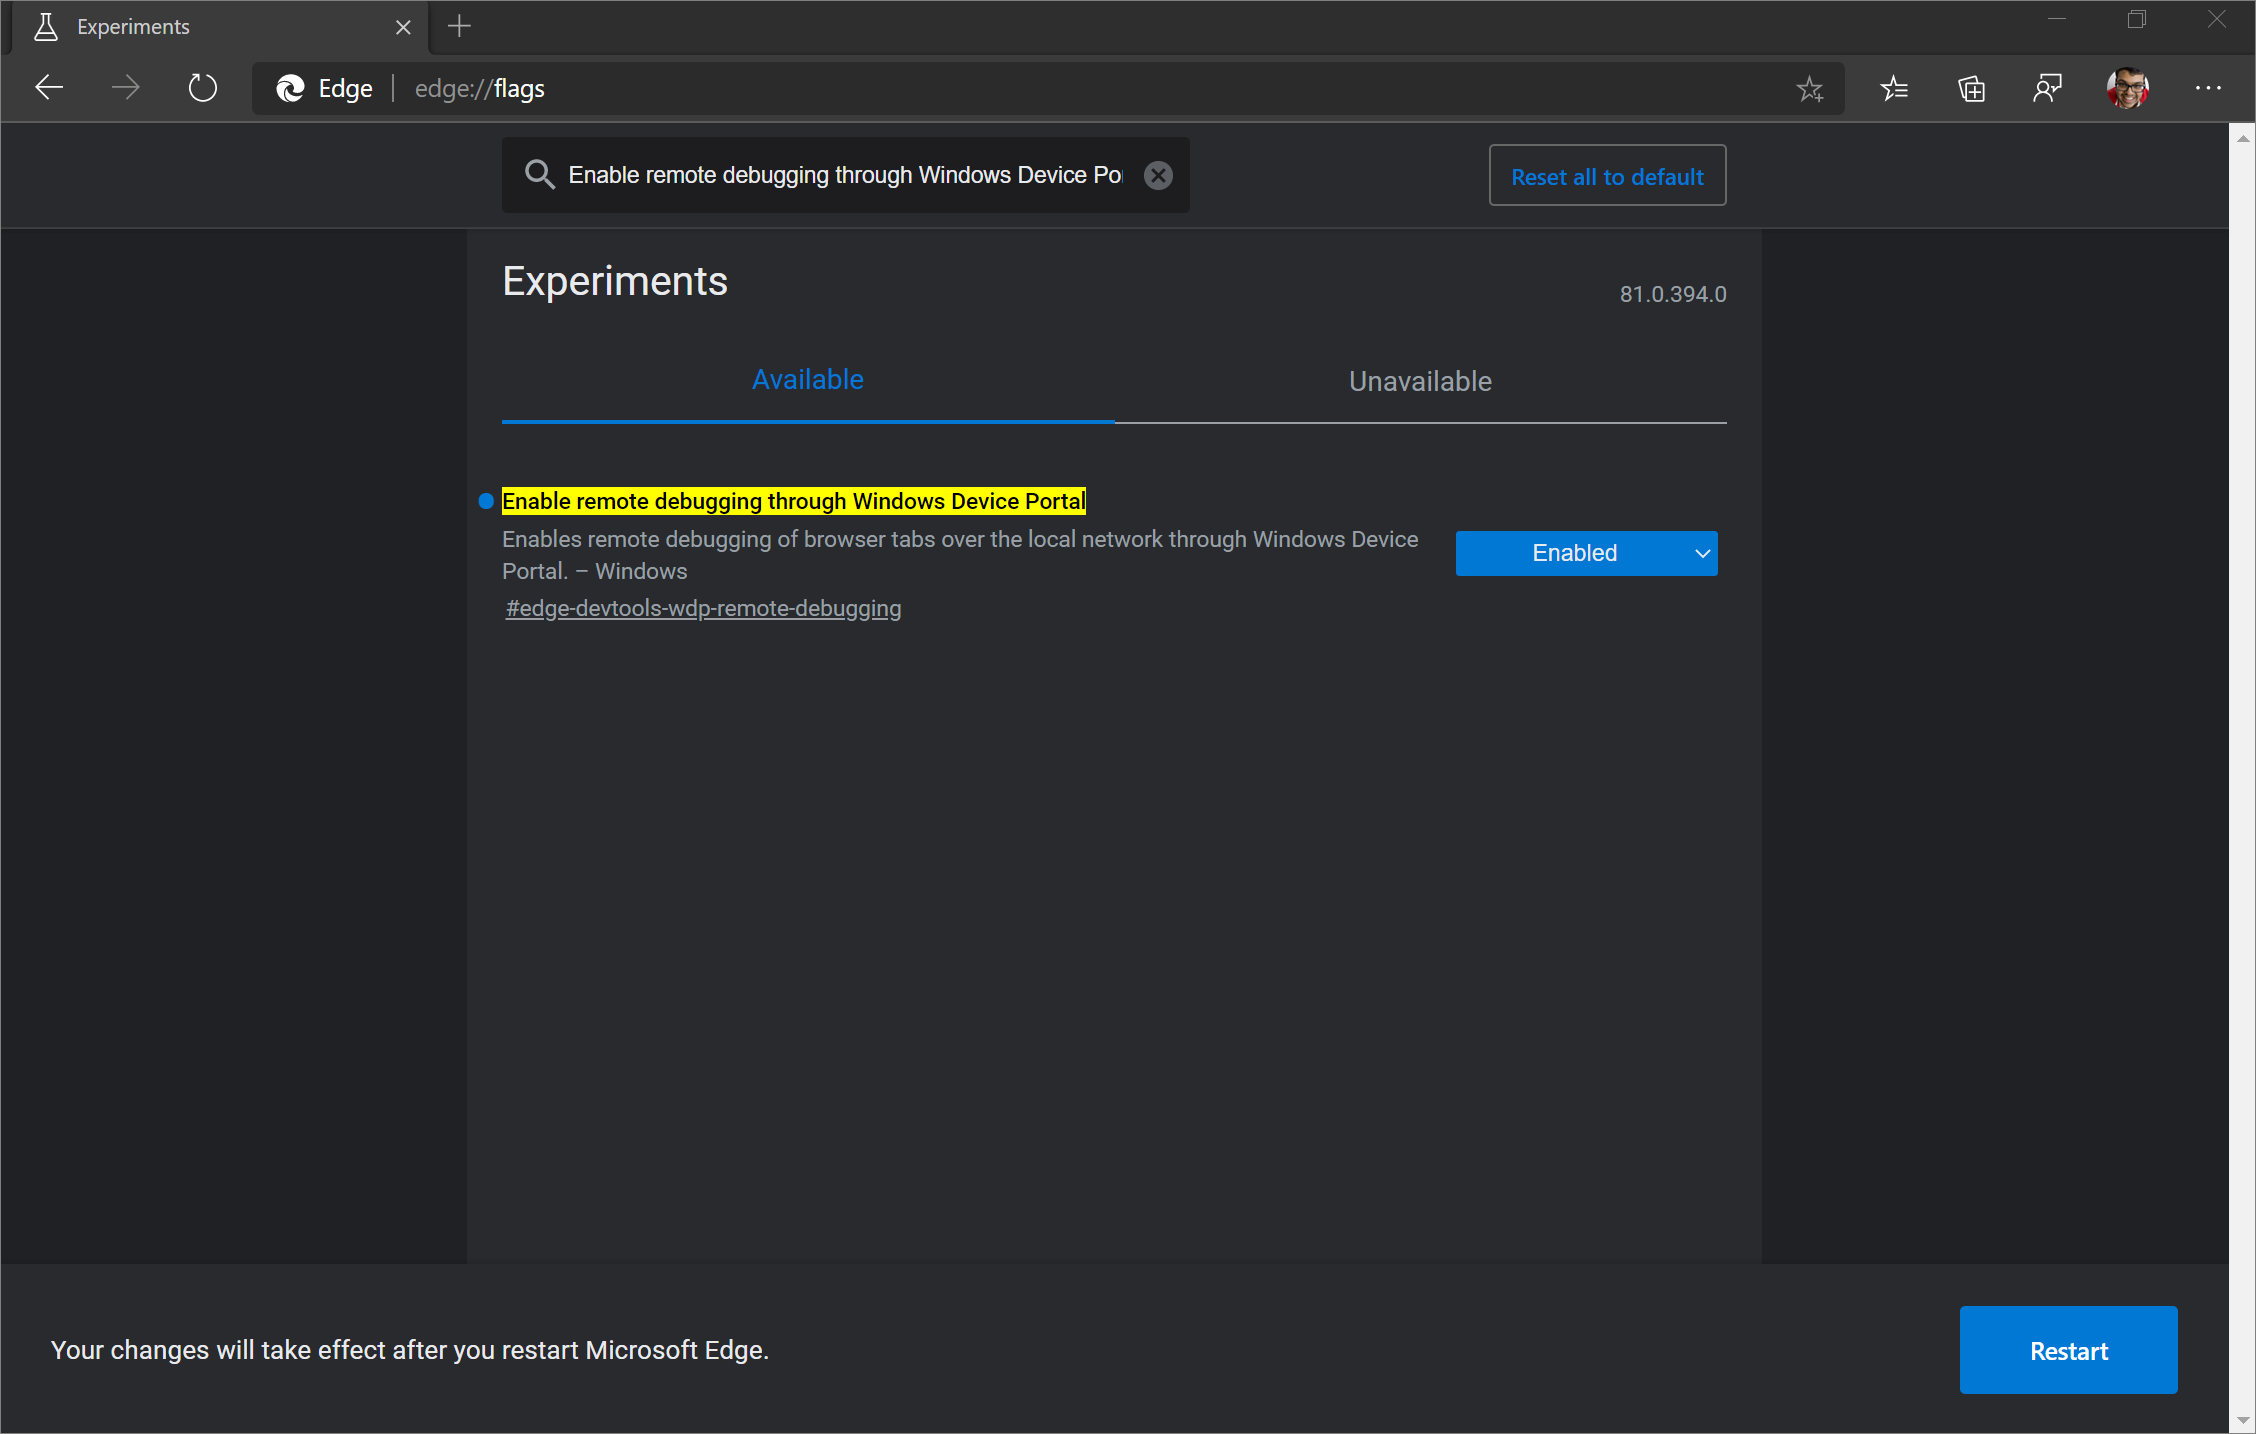
edge://settings/helpin the browser and confirm that the version number is 75 or higher.Go to
edge://flagsin Microsoft Edge.In Search flags, type in Enable remote debugging through Windows Device Portal. Set that flag to Enabled. Then, click the Restart button to restart Microsoft Edge.
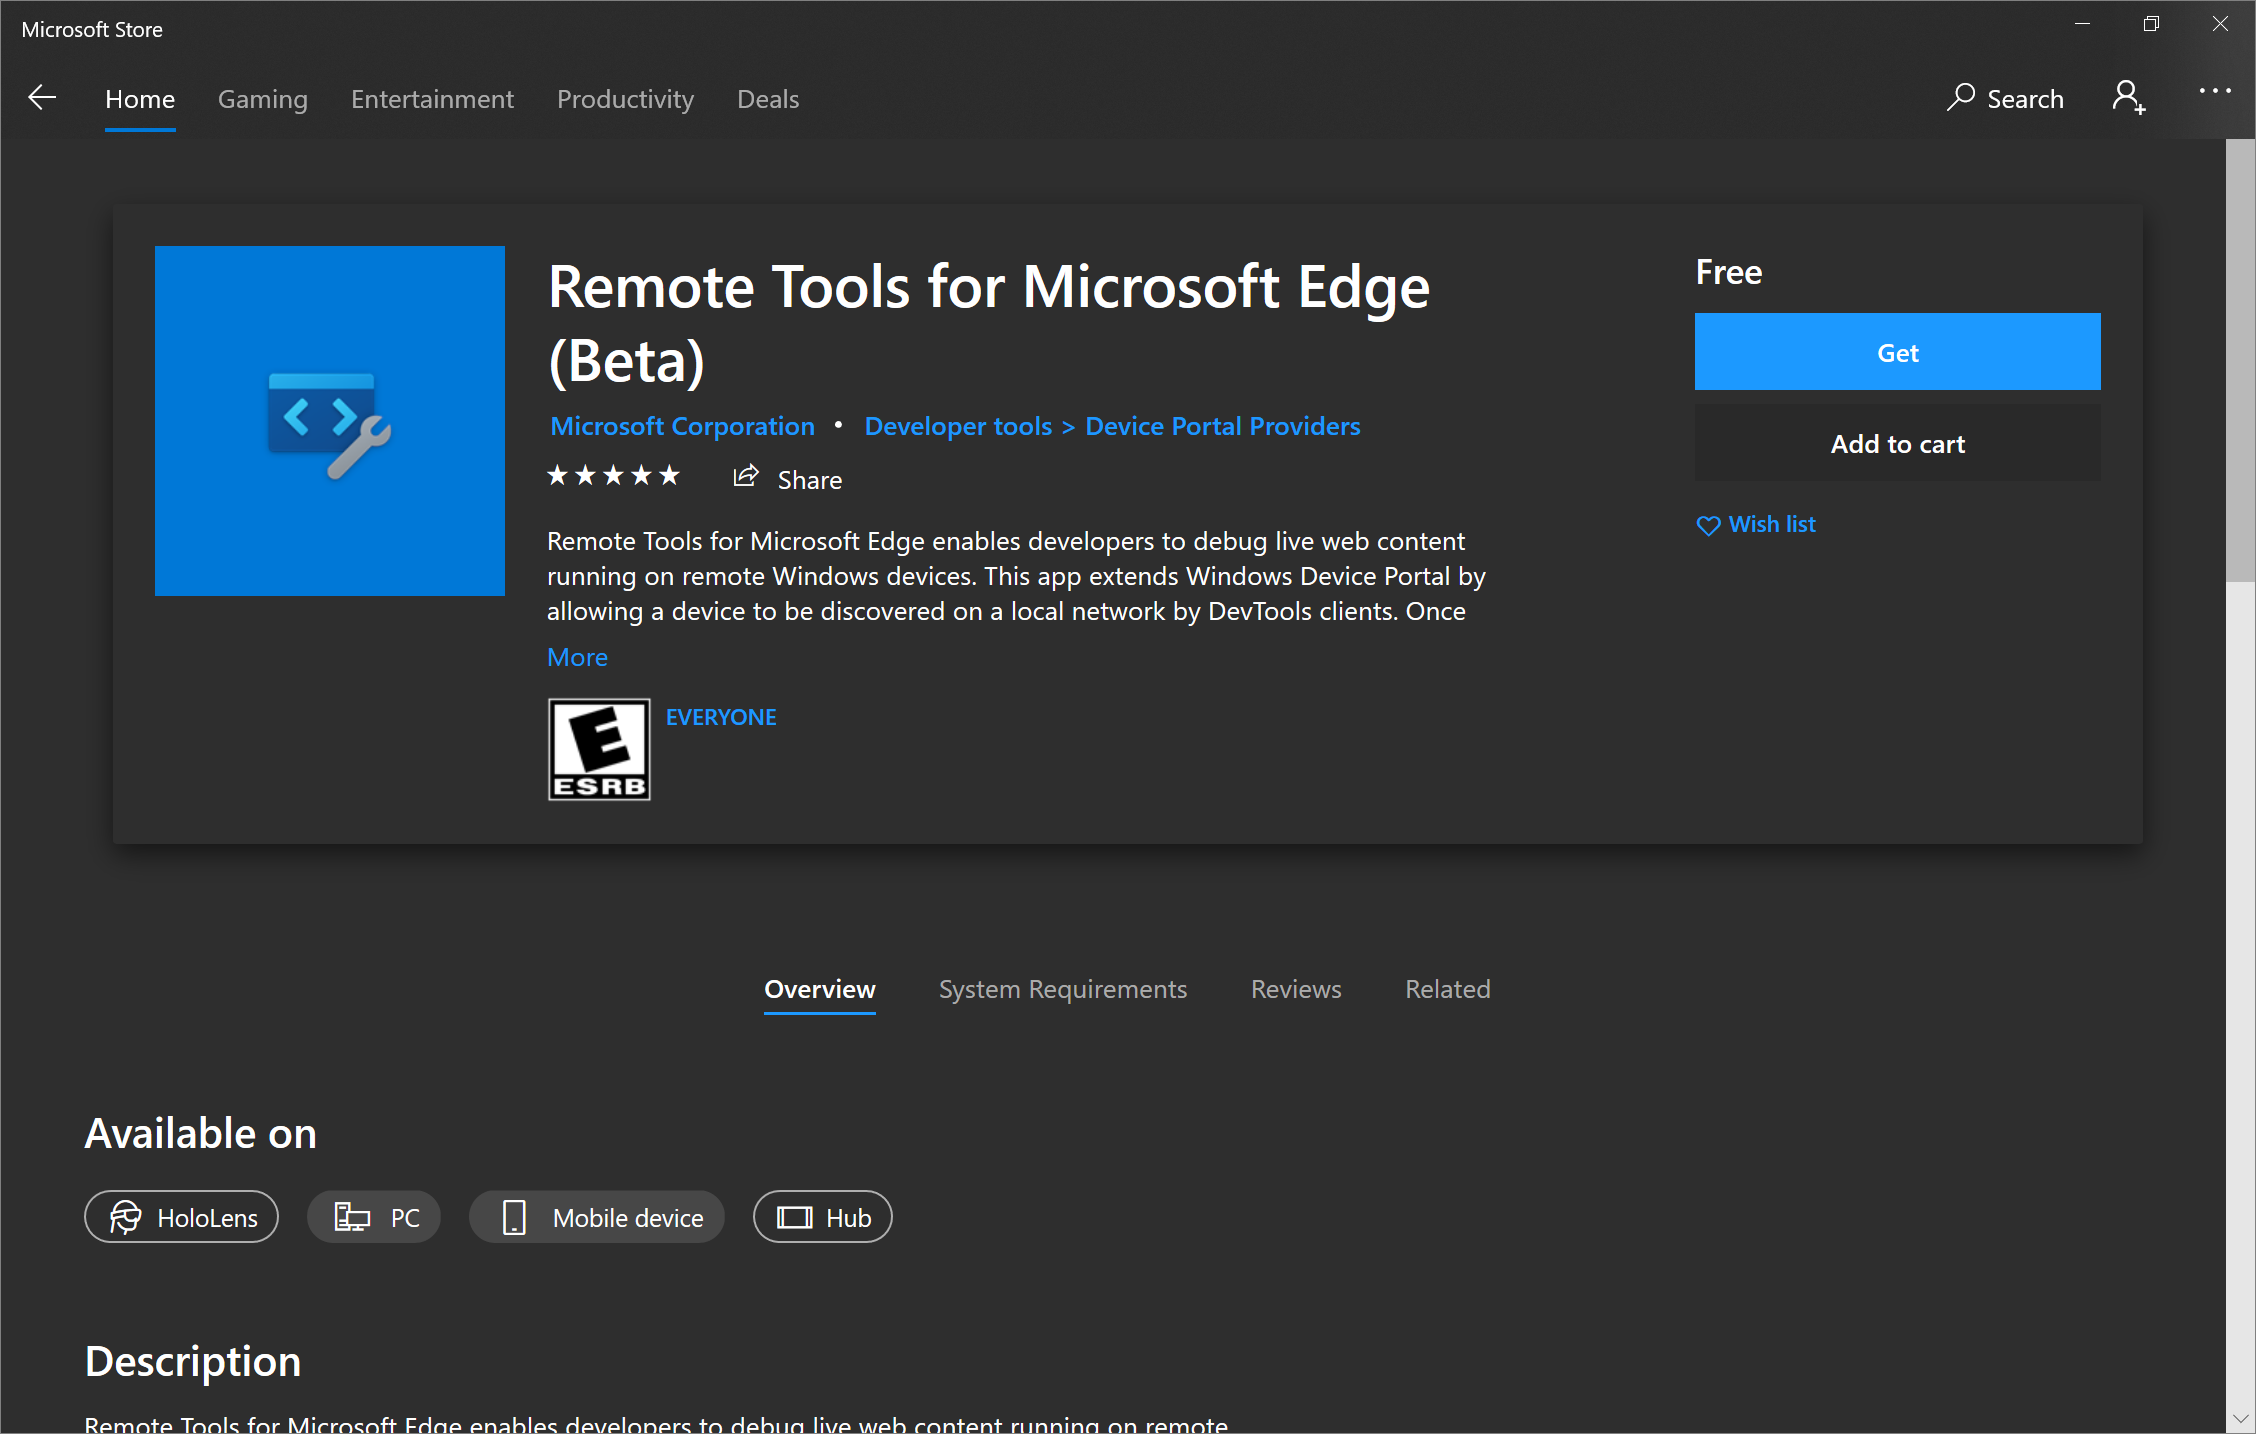
Install the Remote Tools for Microsoft Edge
Install the Remote Tools for Microsoft Edge from the Microsoft Store.
To set up the host (debuggee) machine, it must be running Windows 10 version 1903 or later. If you are on Windows 10 or later version 1809 or earlier, the Download or Get button in that Remote Tools for Microsoft Edge page might be disabled. Update the host (debuggee) machine, to acquire Remote Tools for Microsoft Edge.
Launch Remote Tools for Microsoft Edge and, if prompted, accept the permissions dialog in the app.
Close Remote Tools for Microsoft Edge. You don't need to have it open for future remote debugging sessions.
Activate Developer Mode and enable Device Portal
Activate Developer Mode; see Enable your device for development.
Enable Device Portal; see Windows Device Portal overview.
If you are on a WiFi network, make sure the network is marked as either Domain or Private. You can verify the state by opening the Windows Security app, selecting Firewall & network protection and checking if your network is listed as a Domain network or Private network.
If your network is listed as Public, go to Settings > Network & Internet > Wi-Fi, click on your network, and toggle the Network profile button to Private.
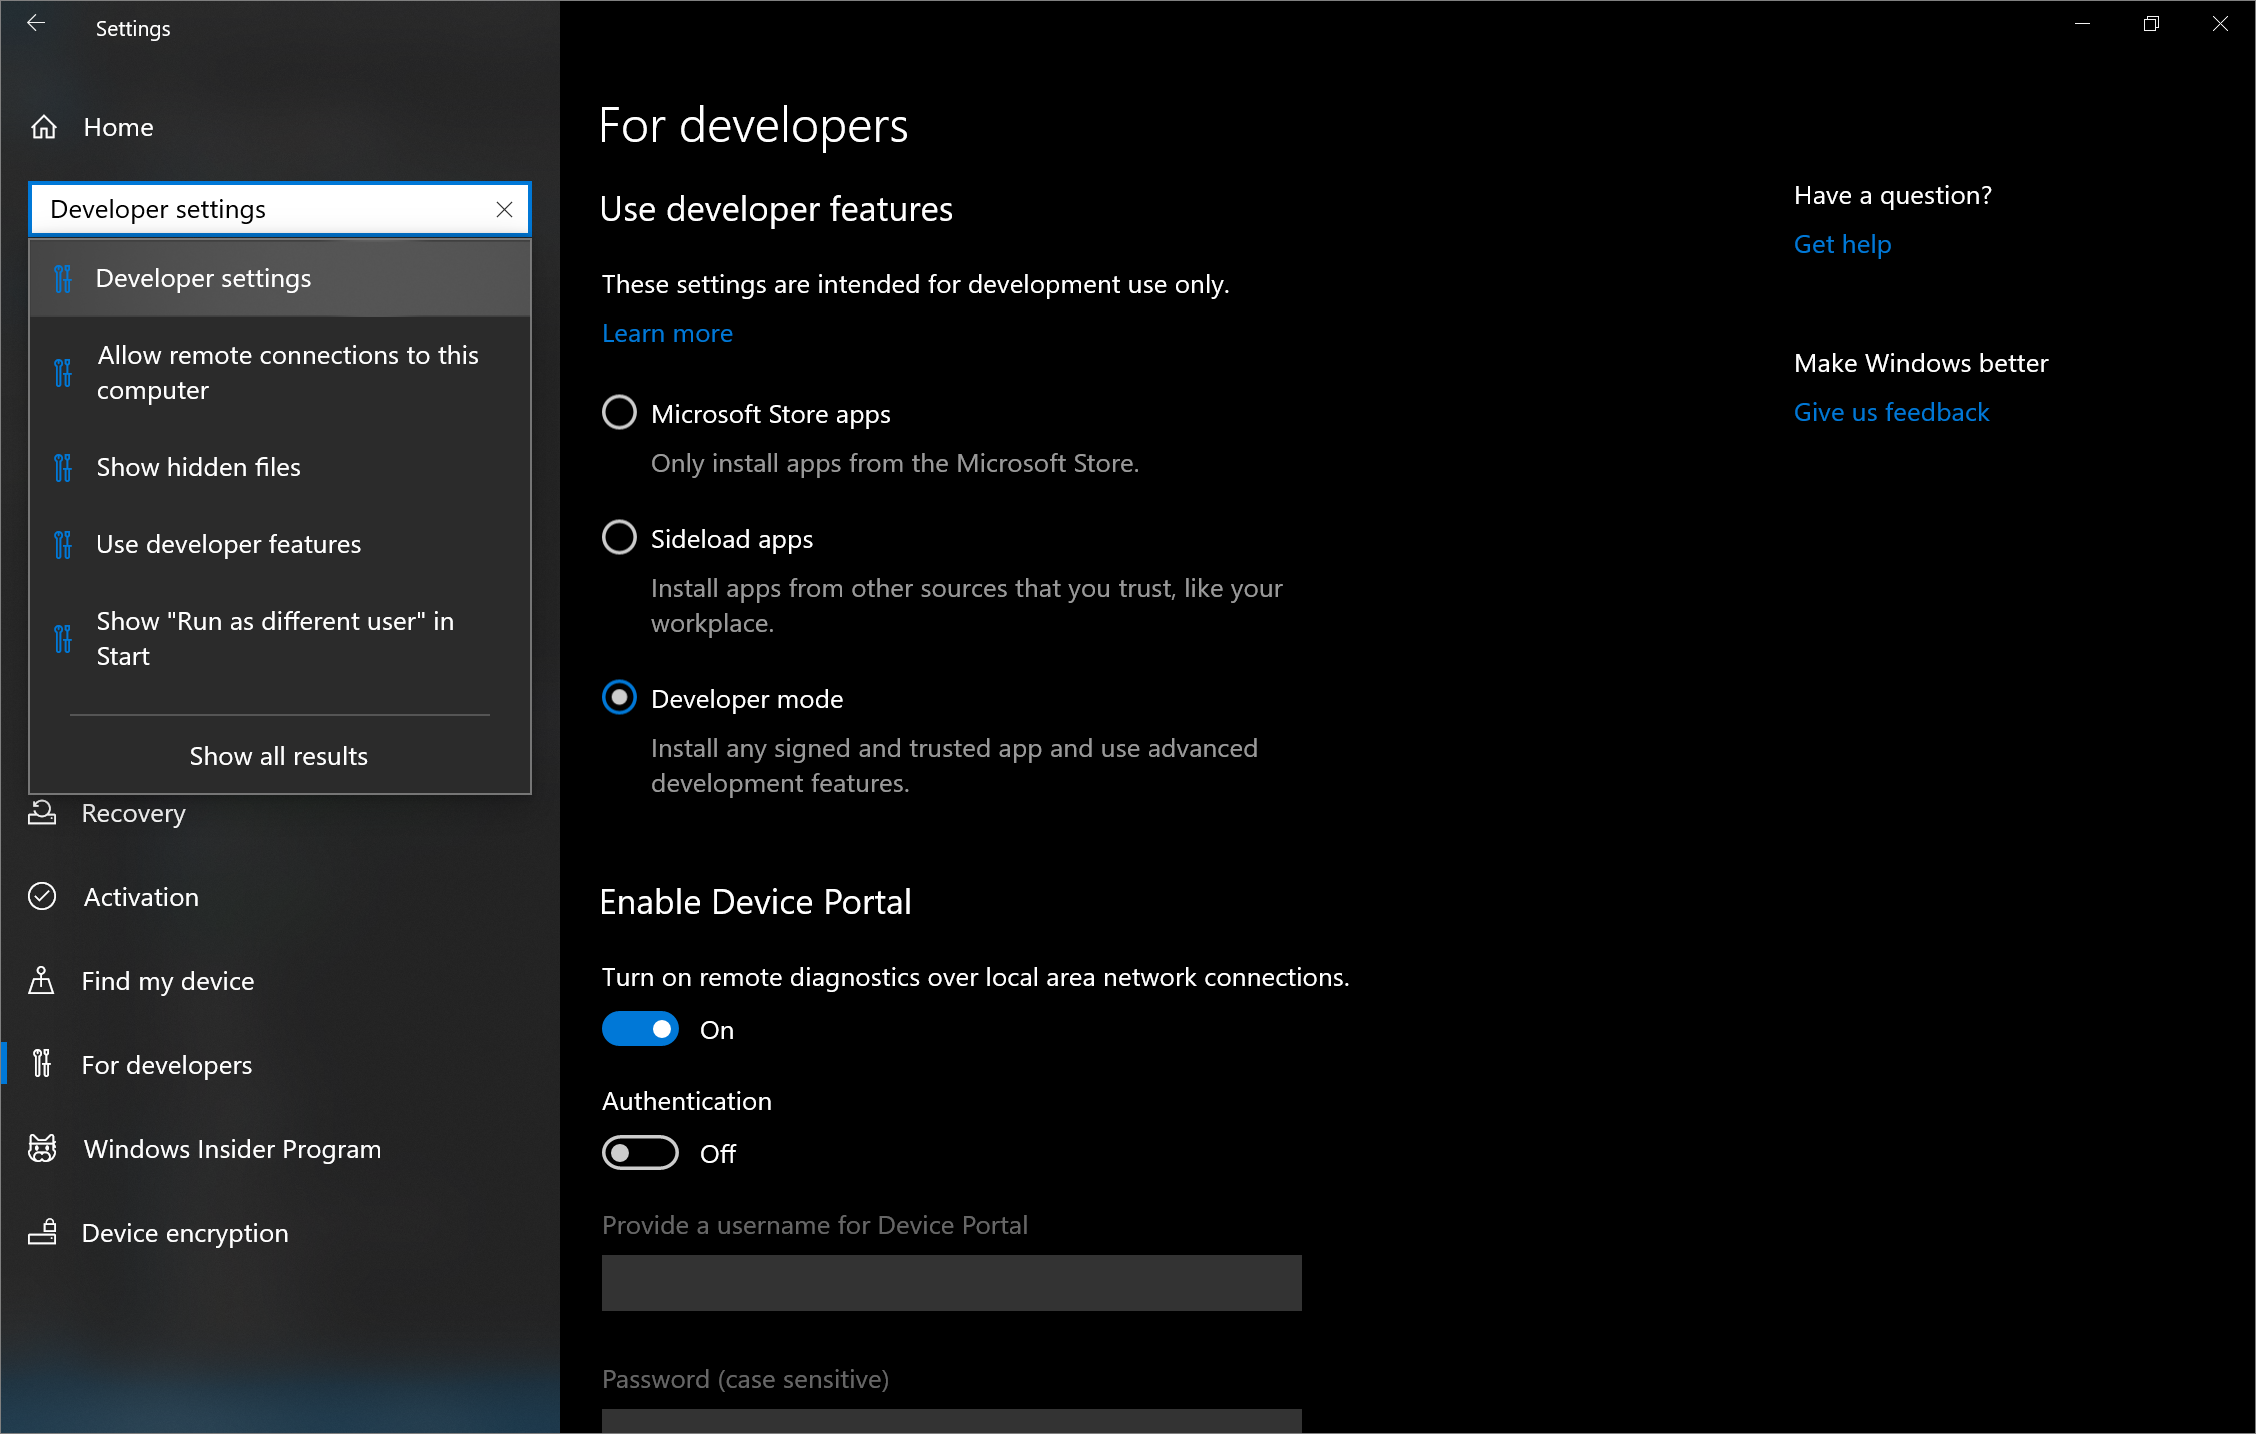
Open the Settings app. In Find a setting, enter
Developer settingsand select it. Toggle on Developer Mode. You can now turn on the Device Portal by setting Turn on remote diagnostics over local area network connections to On. You can then optionally turn Authentication on so that the client (debugger) device must provide the correct credentials to connect to this device.If Turn on remote diagnostics over local area network connections. was previously turned on, you must turn it off and turn it on again for Device Portal to work with Remote Tools for Microsoft Edge.
If a For developers section isn't displayed in Settings, Device Portal may already be turned on, so try restarting the Windows 10 or later device instead.
Note the machine IP address and connection port that are displayed under Connect using:. The IP address in the image below is
192.168.86.78and the connection port is50080: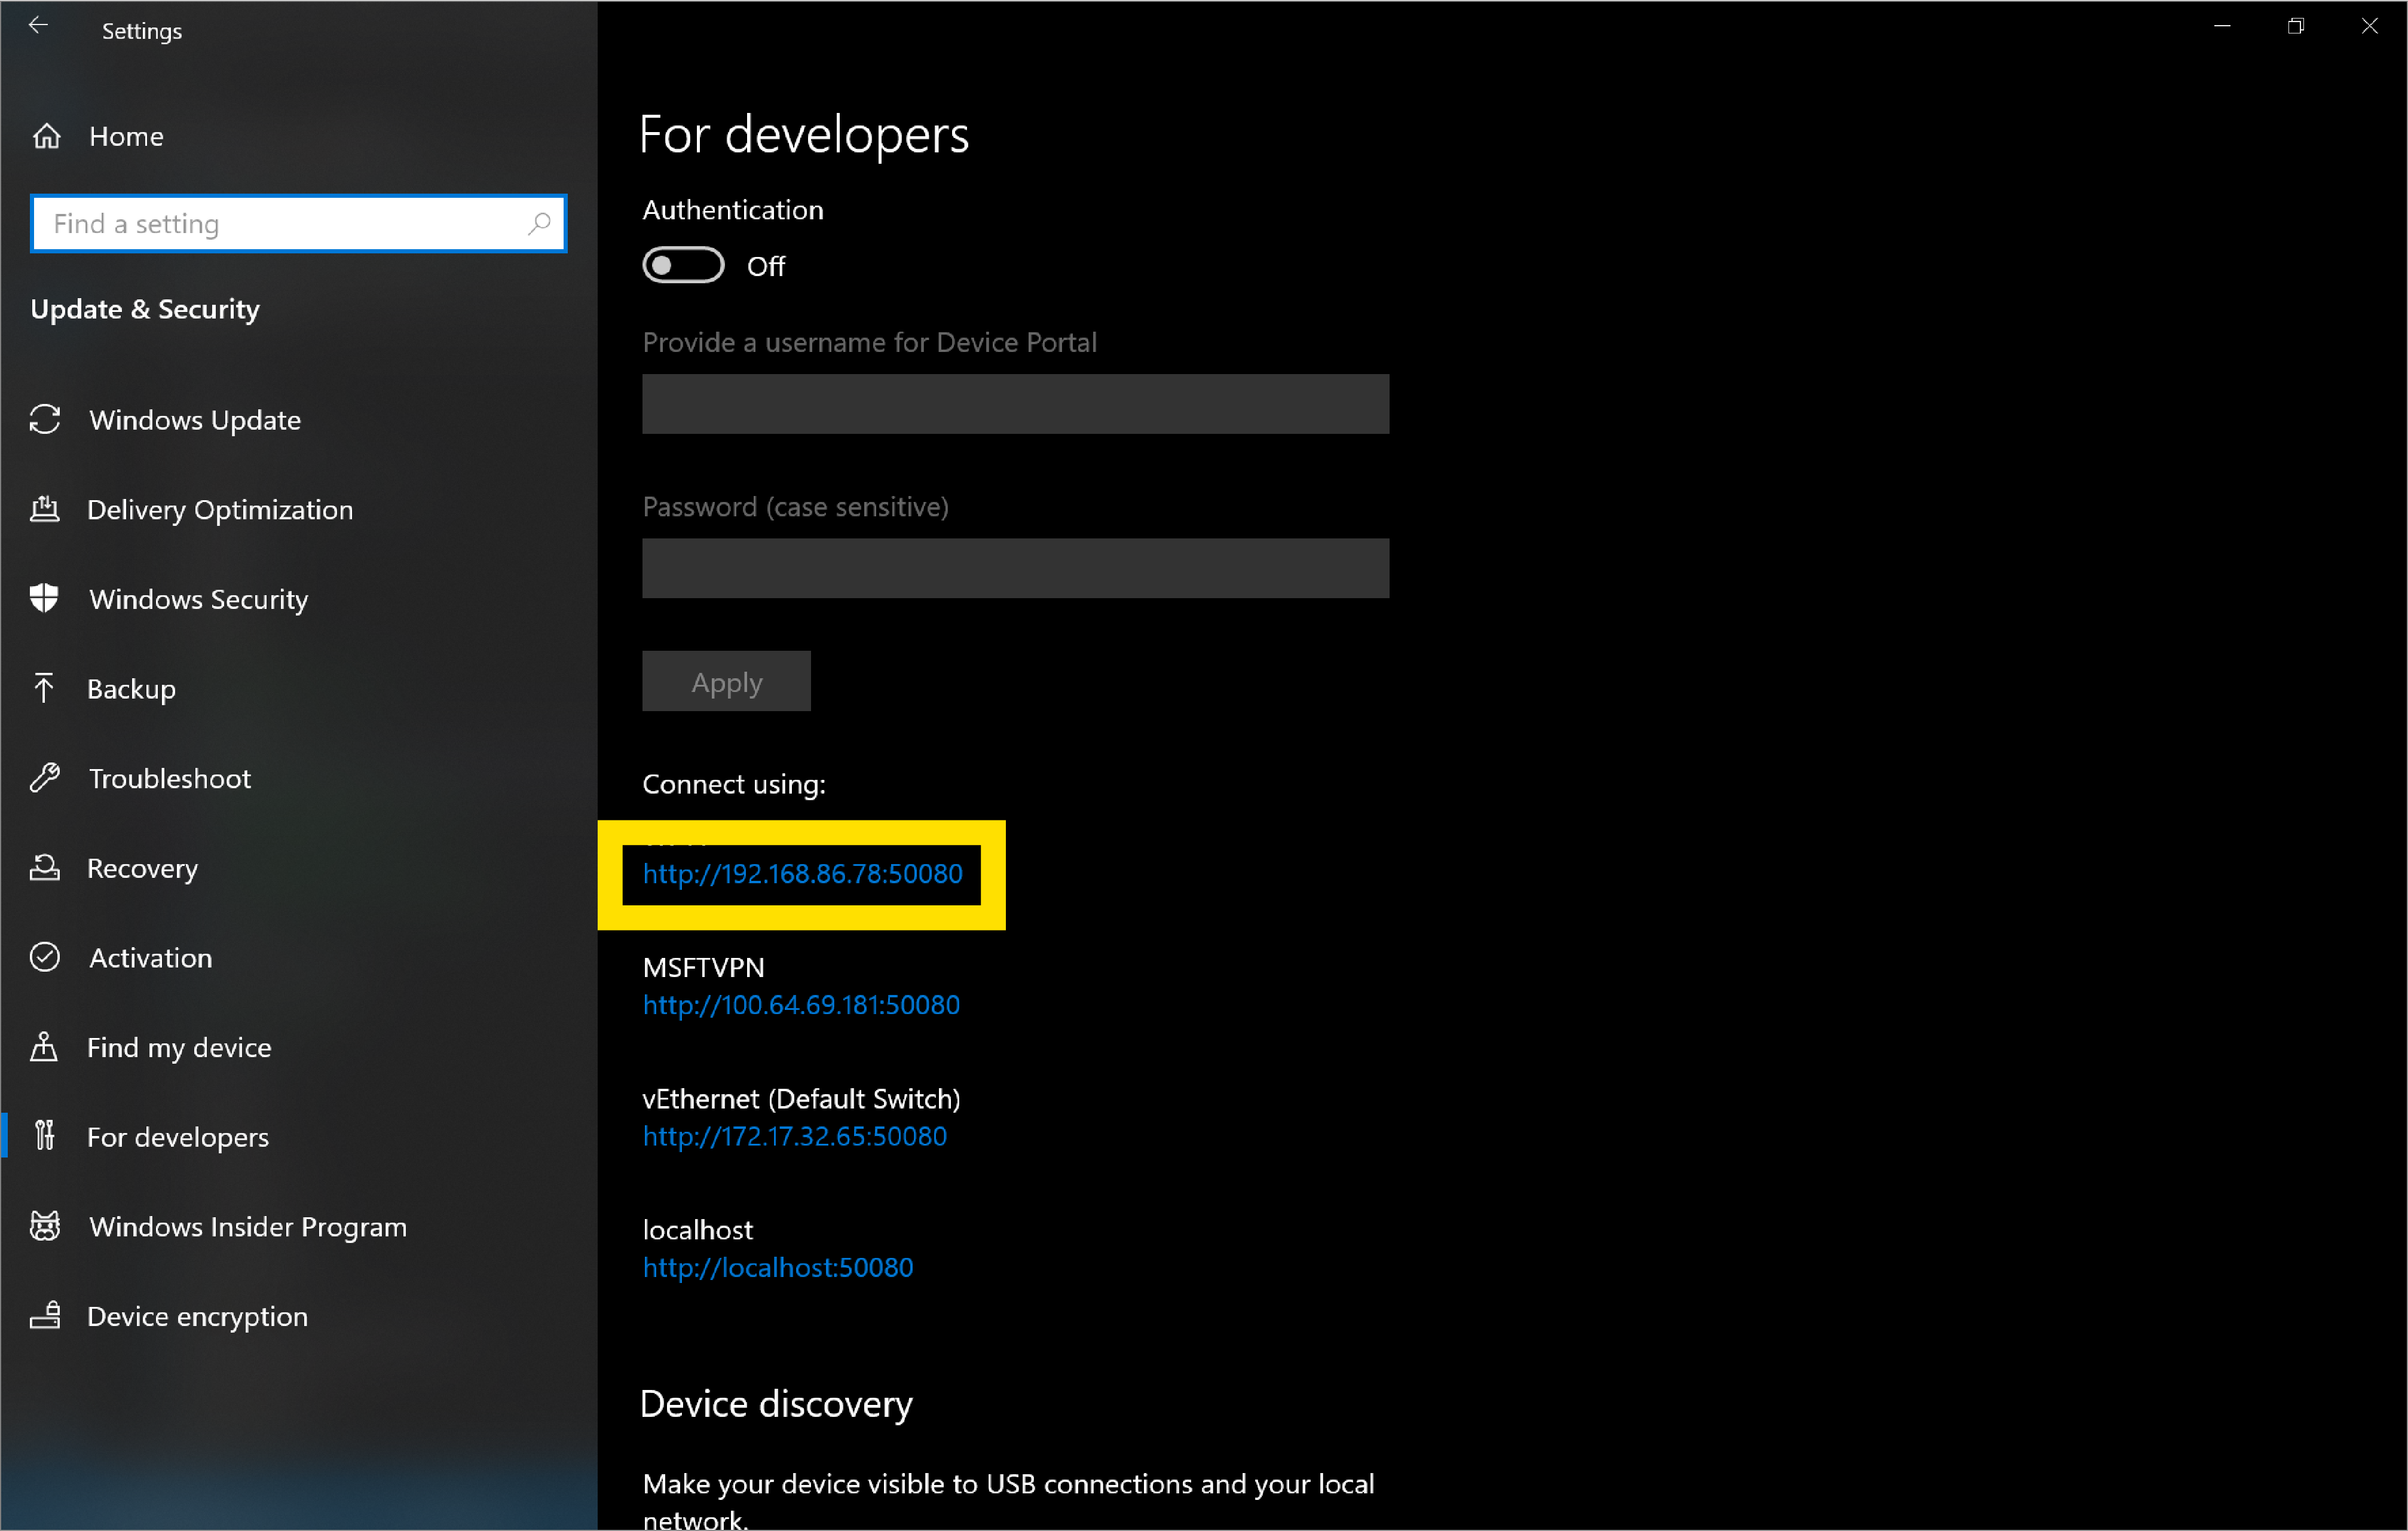
You enter the information on the client (debugger) device in the next section, "Step 2: Set up the client (debugger machine)".
Open tabs in Microsoft Edge and Progressive Web Apps (PWAs) on the host (debuggee) machine that you want to debug from the client (debugger) machine.
Step 2: Set up the client (debugger machine)
The client or debugger machine is the device you want to debug from. This device may be your daily development machine, or it may just be your PC or MacBook when working from home.
To set up the client (debugger) machine, install Microsoft Edge from Get to know Microsoft Edge if you haven't already.
If you're using a pre-installed version of Microsoft Edge on the host (debuggee) machine, verify that you have Microsoft Edge (Chromium) and not Microsoft Edge (EdgeHTML). A quick way to check is to load
edge://settings/helpin the browser and confirm that the version number is 75 or higher.Go to the
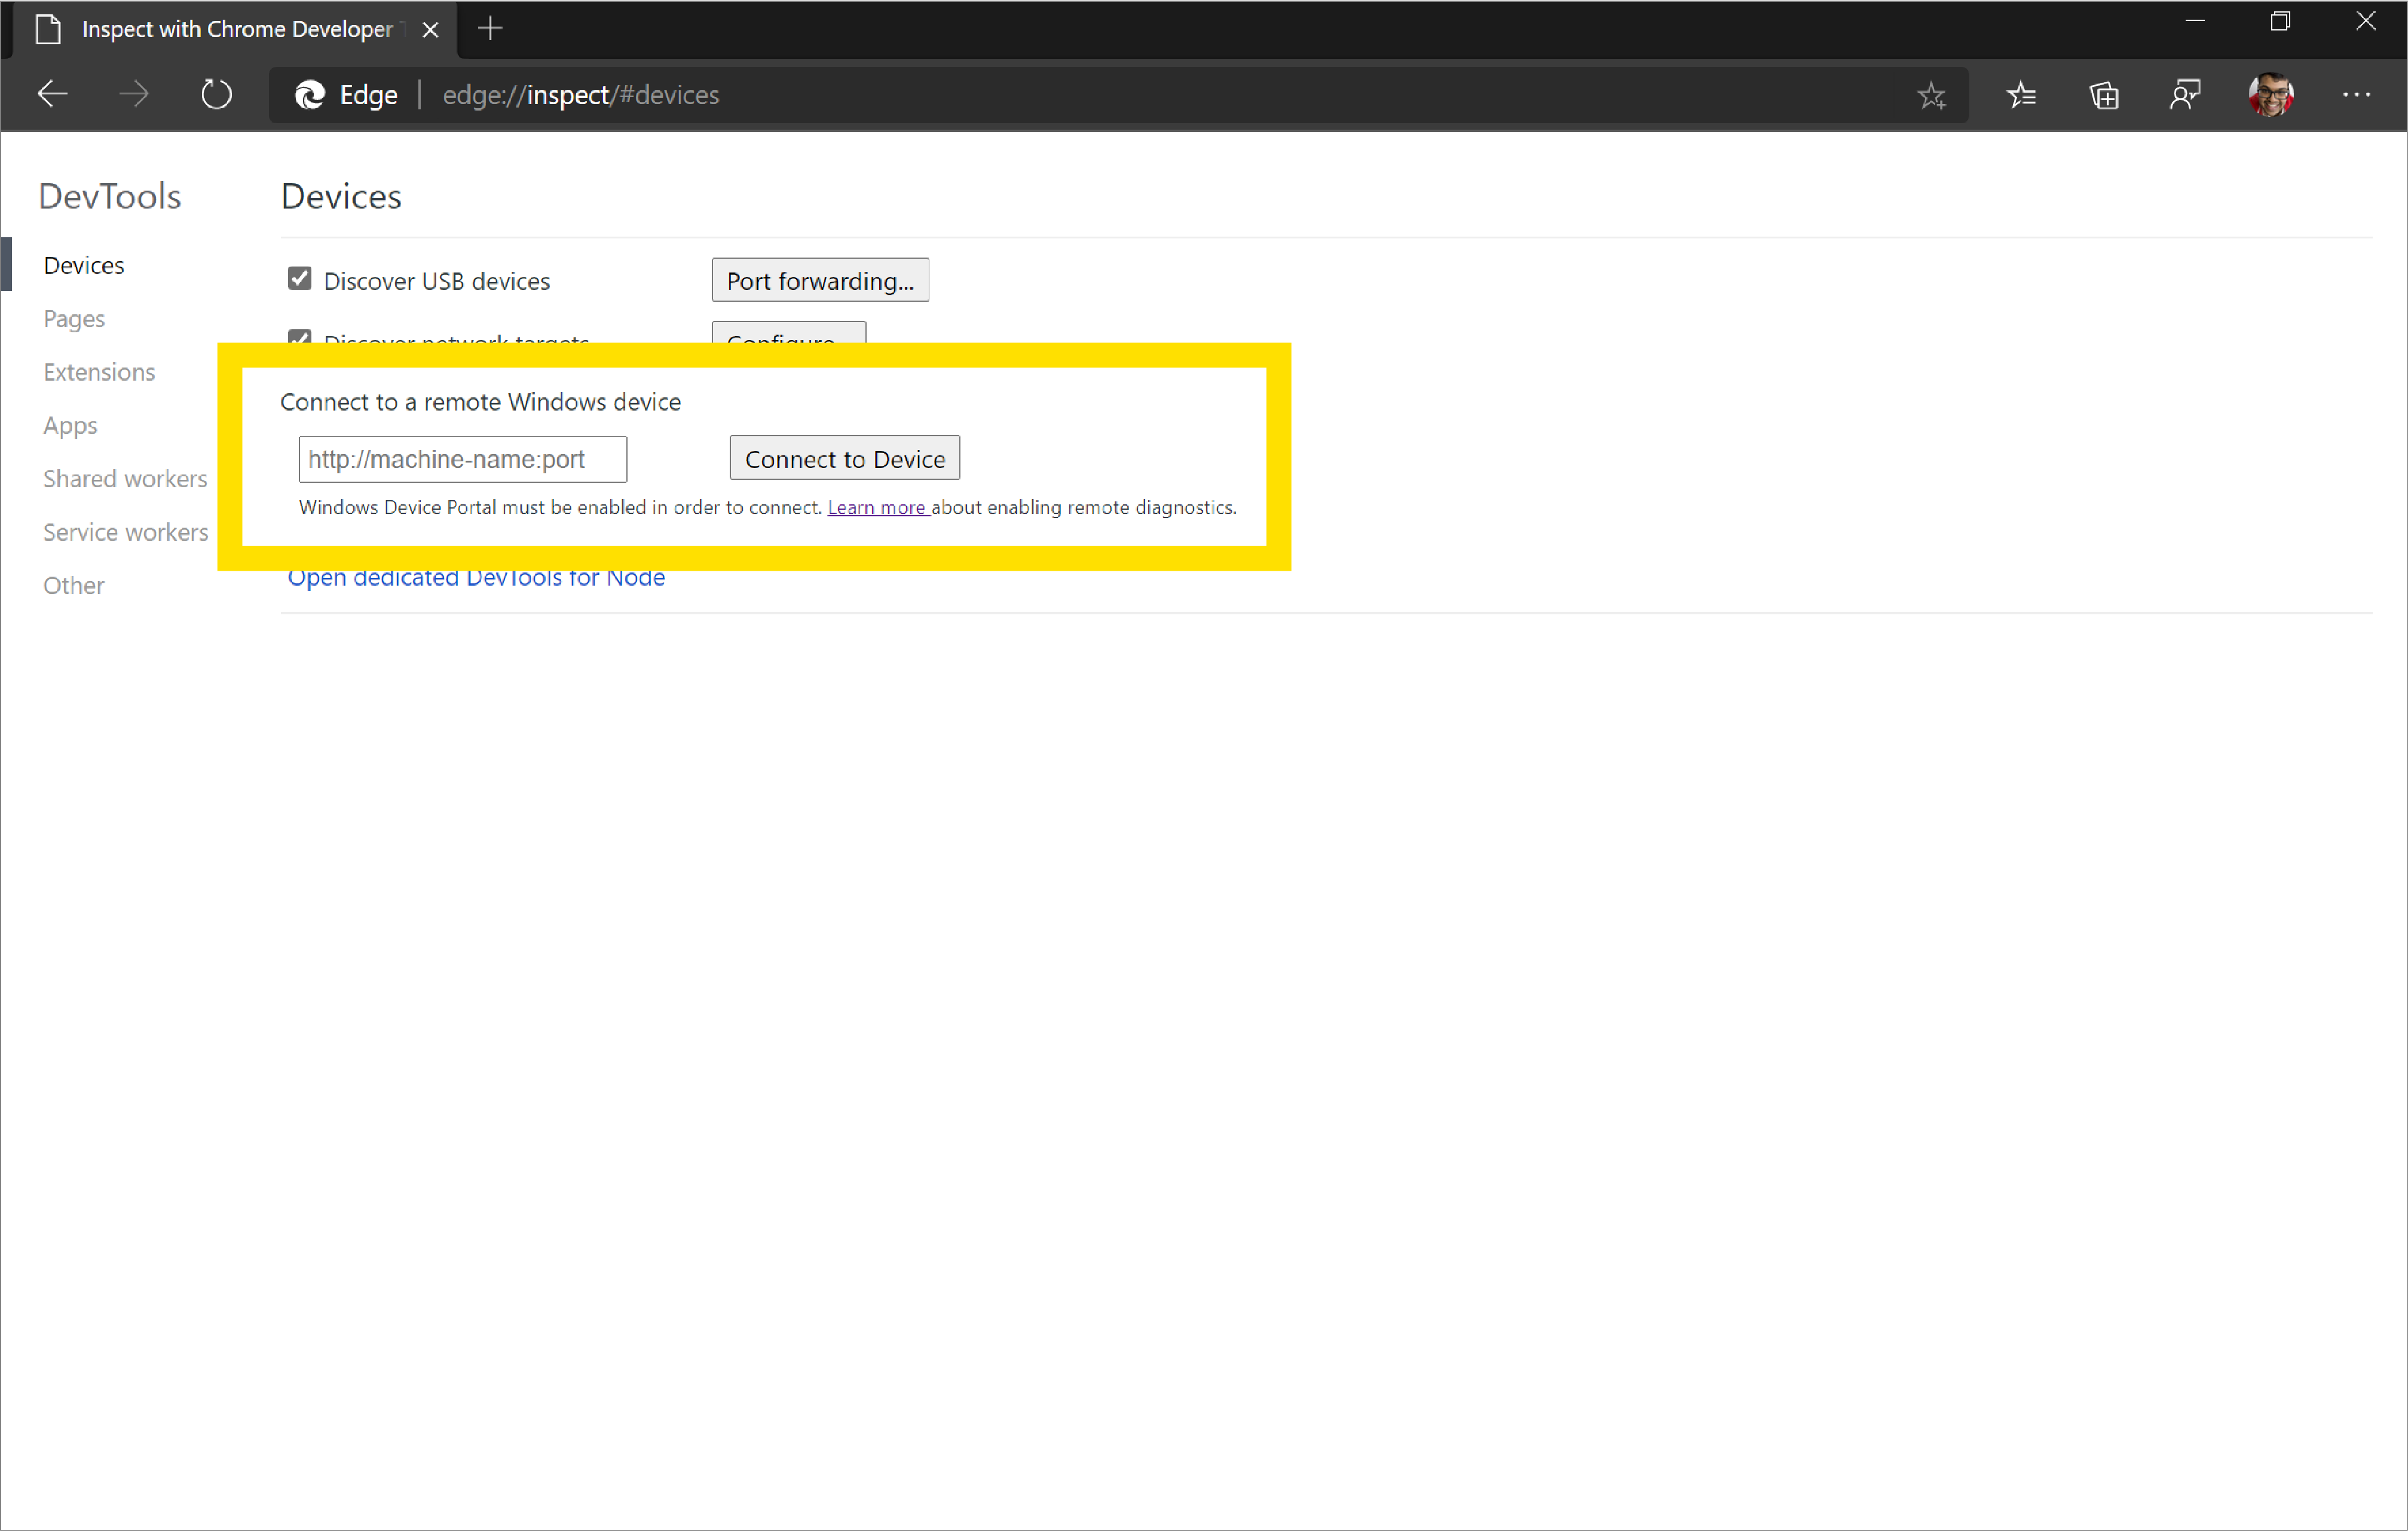
edge://inspectpage in Microsoft Edge. By default, you should be on the Devices section.Under Connect to a remote Windows device, enter the IP address and the connection port of the host (debuggee) machine in the text box following this pattern: http://
IP address:connection port.Click Connect to Device.
If you set up authentication for the host (debuggee) machine, you are prompted to enter the Username and Password for the client (debugger) machine to connect successfully.
Using https instead of http
If you want to connect to the host (debuggee) machine using https instead of http:
Go to
http://IP address:50080/config/rootcertificatein Microsoft Edge on the client (debugger) machine. This automatically downloads a security certificate namedrootcertificate.cer.Select
rootcertificate.cer. This opens the Windows Certificate Manager tool.Click Install certificate..., make sure Current User is turned on, and then click Next.
Click Place all certificates in the following store and click Browse....
Select the Trusted Root Certification Authorities store and then click OK.
Click Next and then click Finish.
If prompted, confirm that you want to install this certificate to the Trusted Root Certification Authorities store.
Now, when connecting to the host (debuggee) machine from the client (debugger) machine using the
edge://inspectpage, you must use a differentconnection portvalue. By default, for desktop Windows, the Device Portal uses50080as theconnection portforhttp. Forhttps, the Device Portal uses50043so follow this pattern: https://IP address:50043on theedge://inspectpage.
To see the default ports that are used by Device Portal, see the table in Setup in Windows Device Portal overview.
Default ports
The default port for http is 50080 and the default port for https is 50043, but this isn't always the case, because Device Portal on desktop claims ports in the ephemeral range (>50,000) to prevent collisions with existing port claims on the device.
To see the default ports that are used by Device Portal, see the table in Setup in Windows Device Portal overview.
For information about port settings, see Windows Device Portal for Desktop.
See also:
- Registry-based configuration in Windows Device Portal for Desktop.
Step 3: Debug content on the host from the client
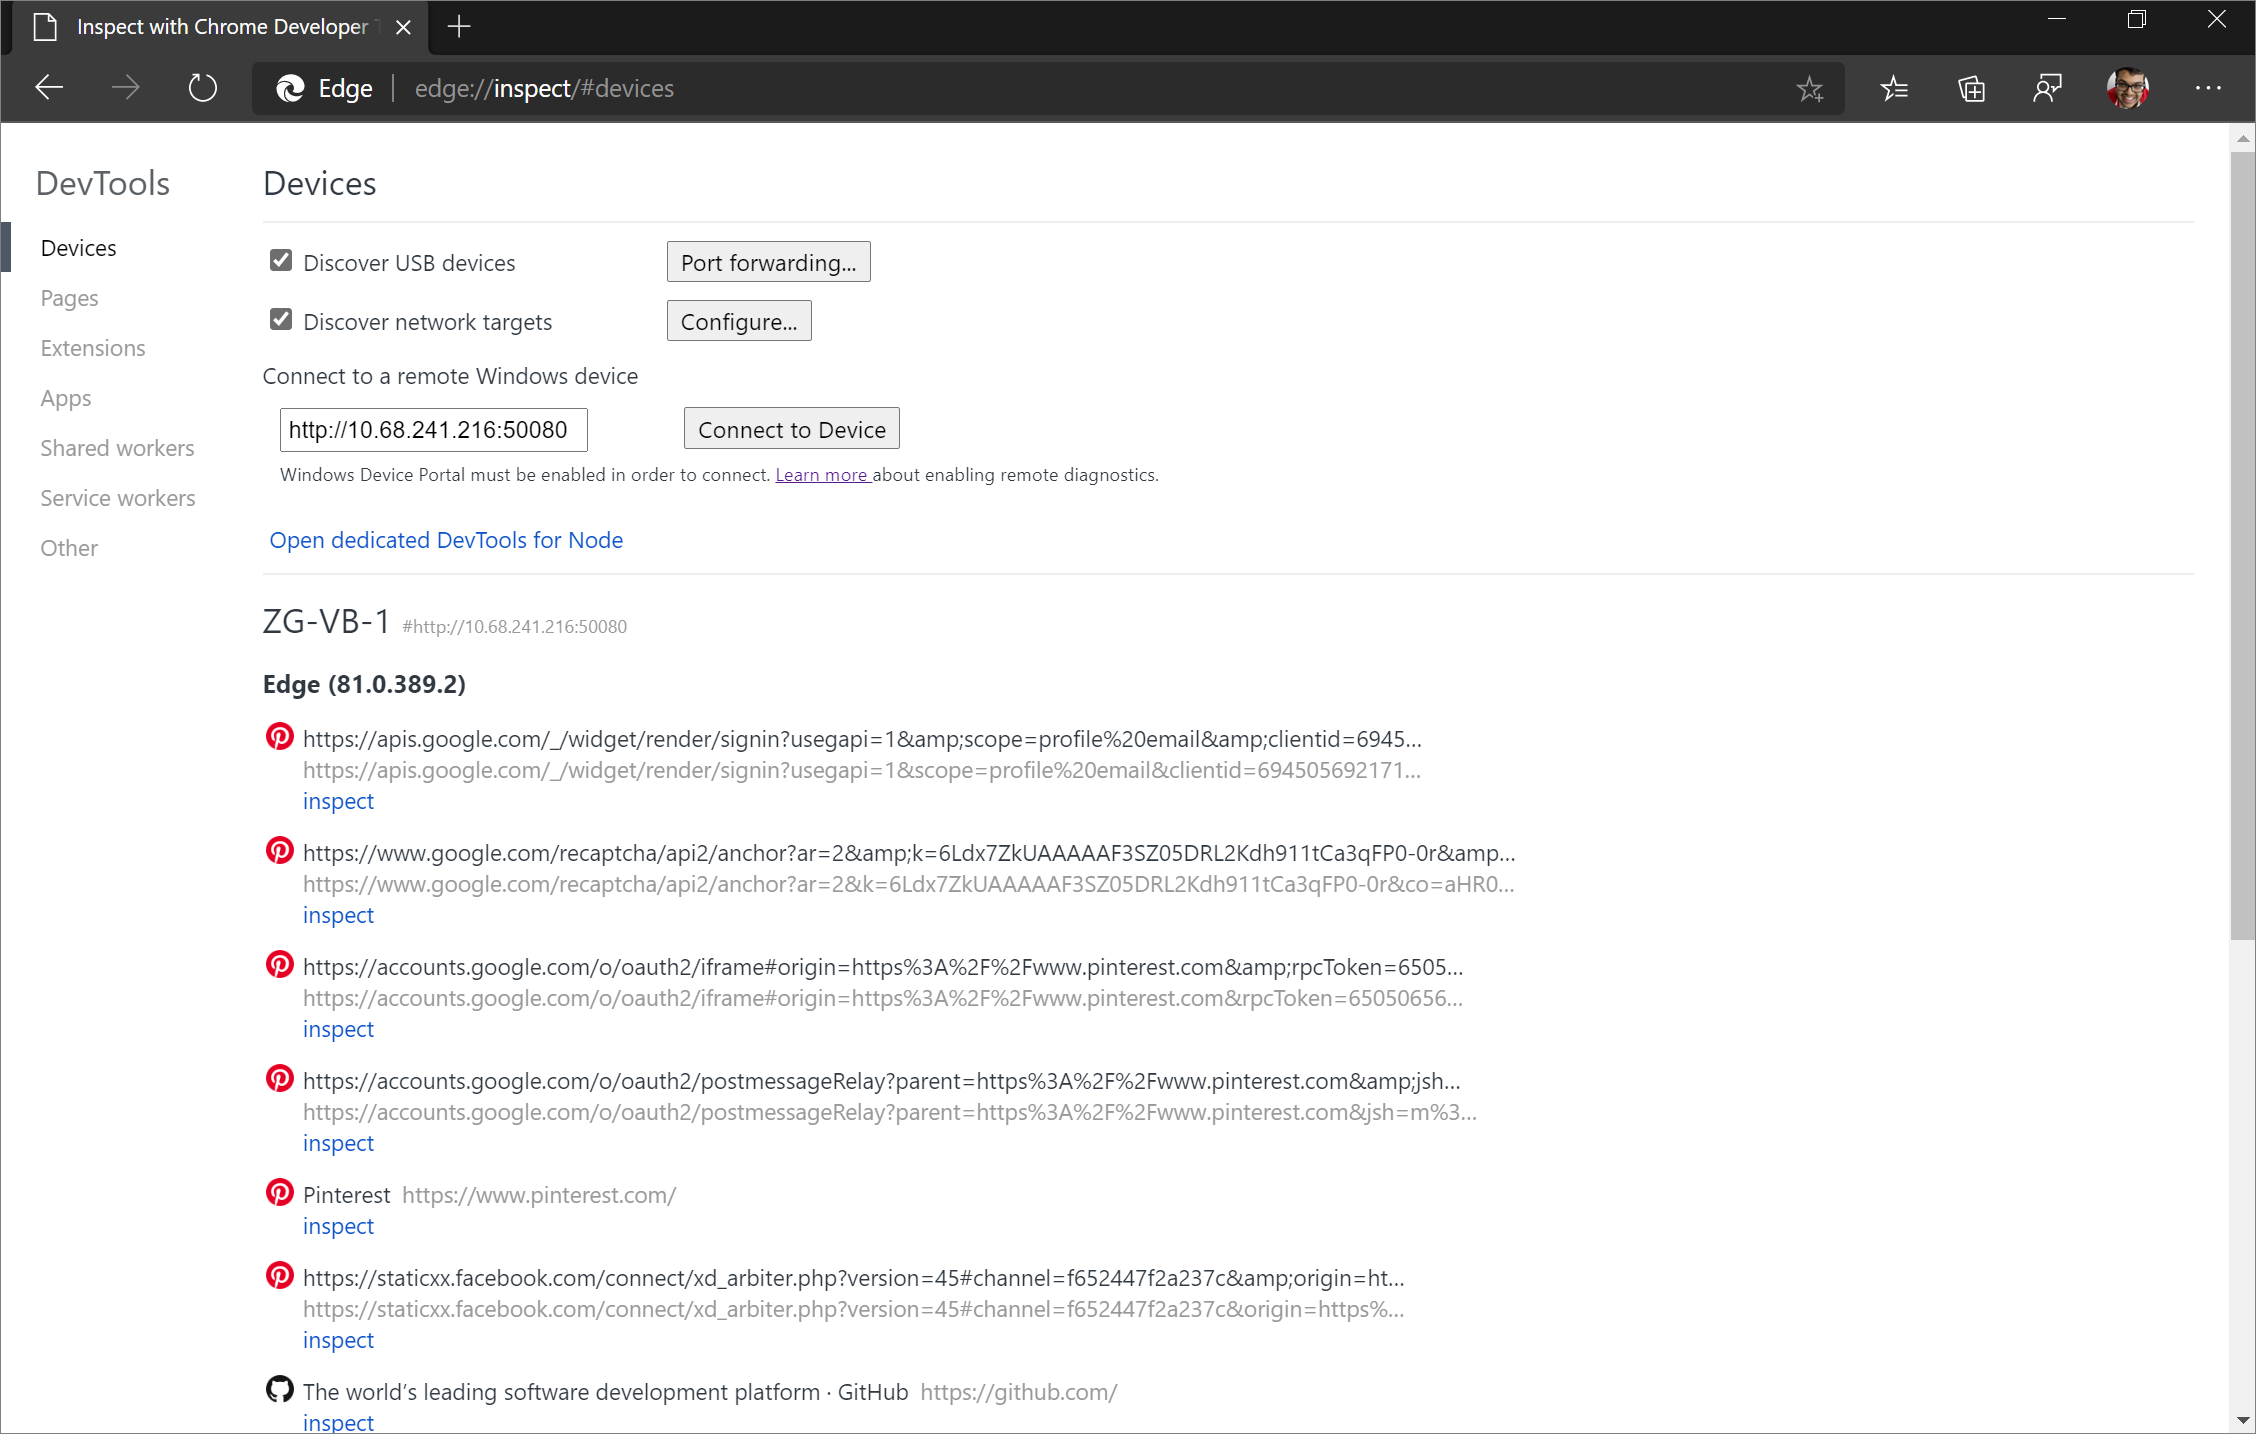
If the client (debugger) machine successfully connects to the host (debuggee) machine, the edge://inspect page on the client now displays a list of the tabs in Microsoft Edge and any open PWAs on the host.
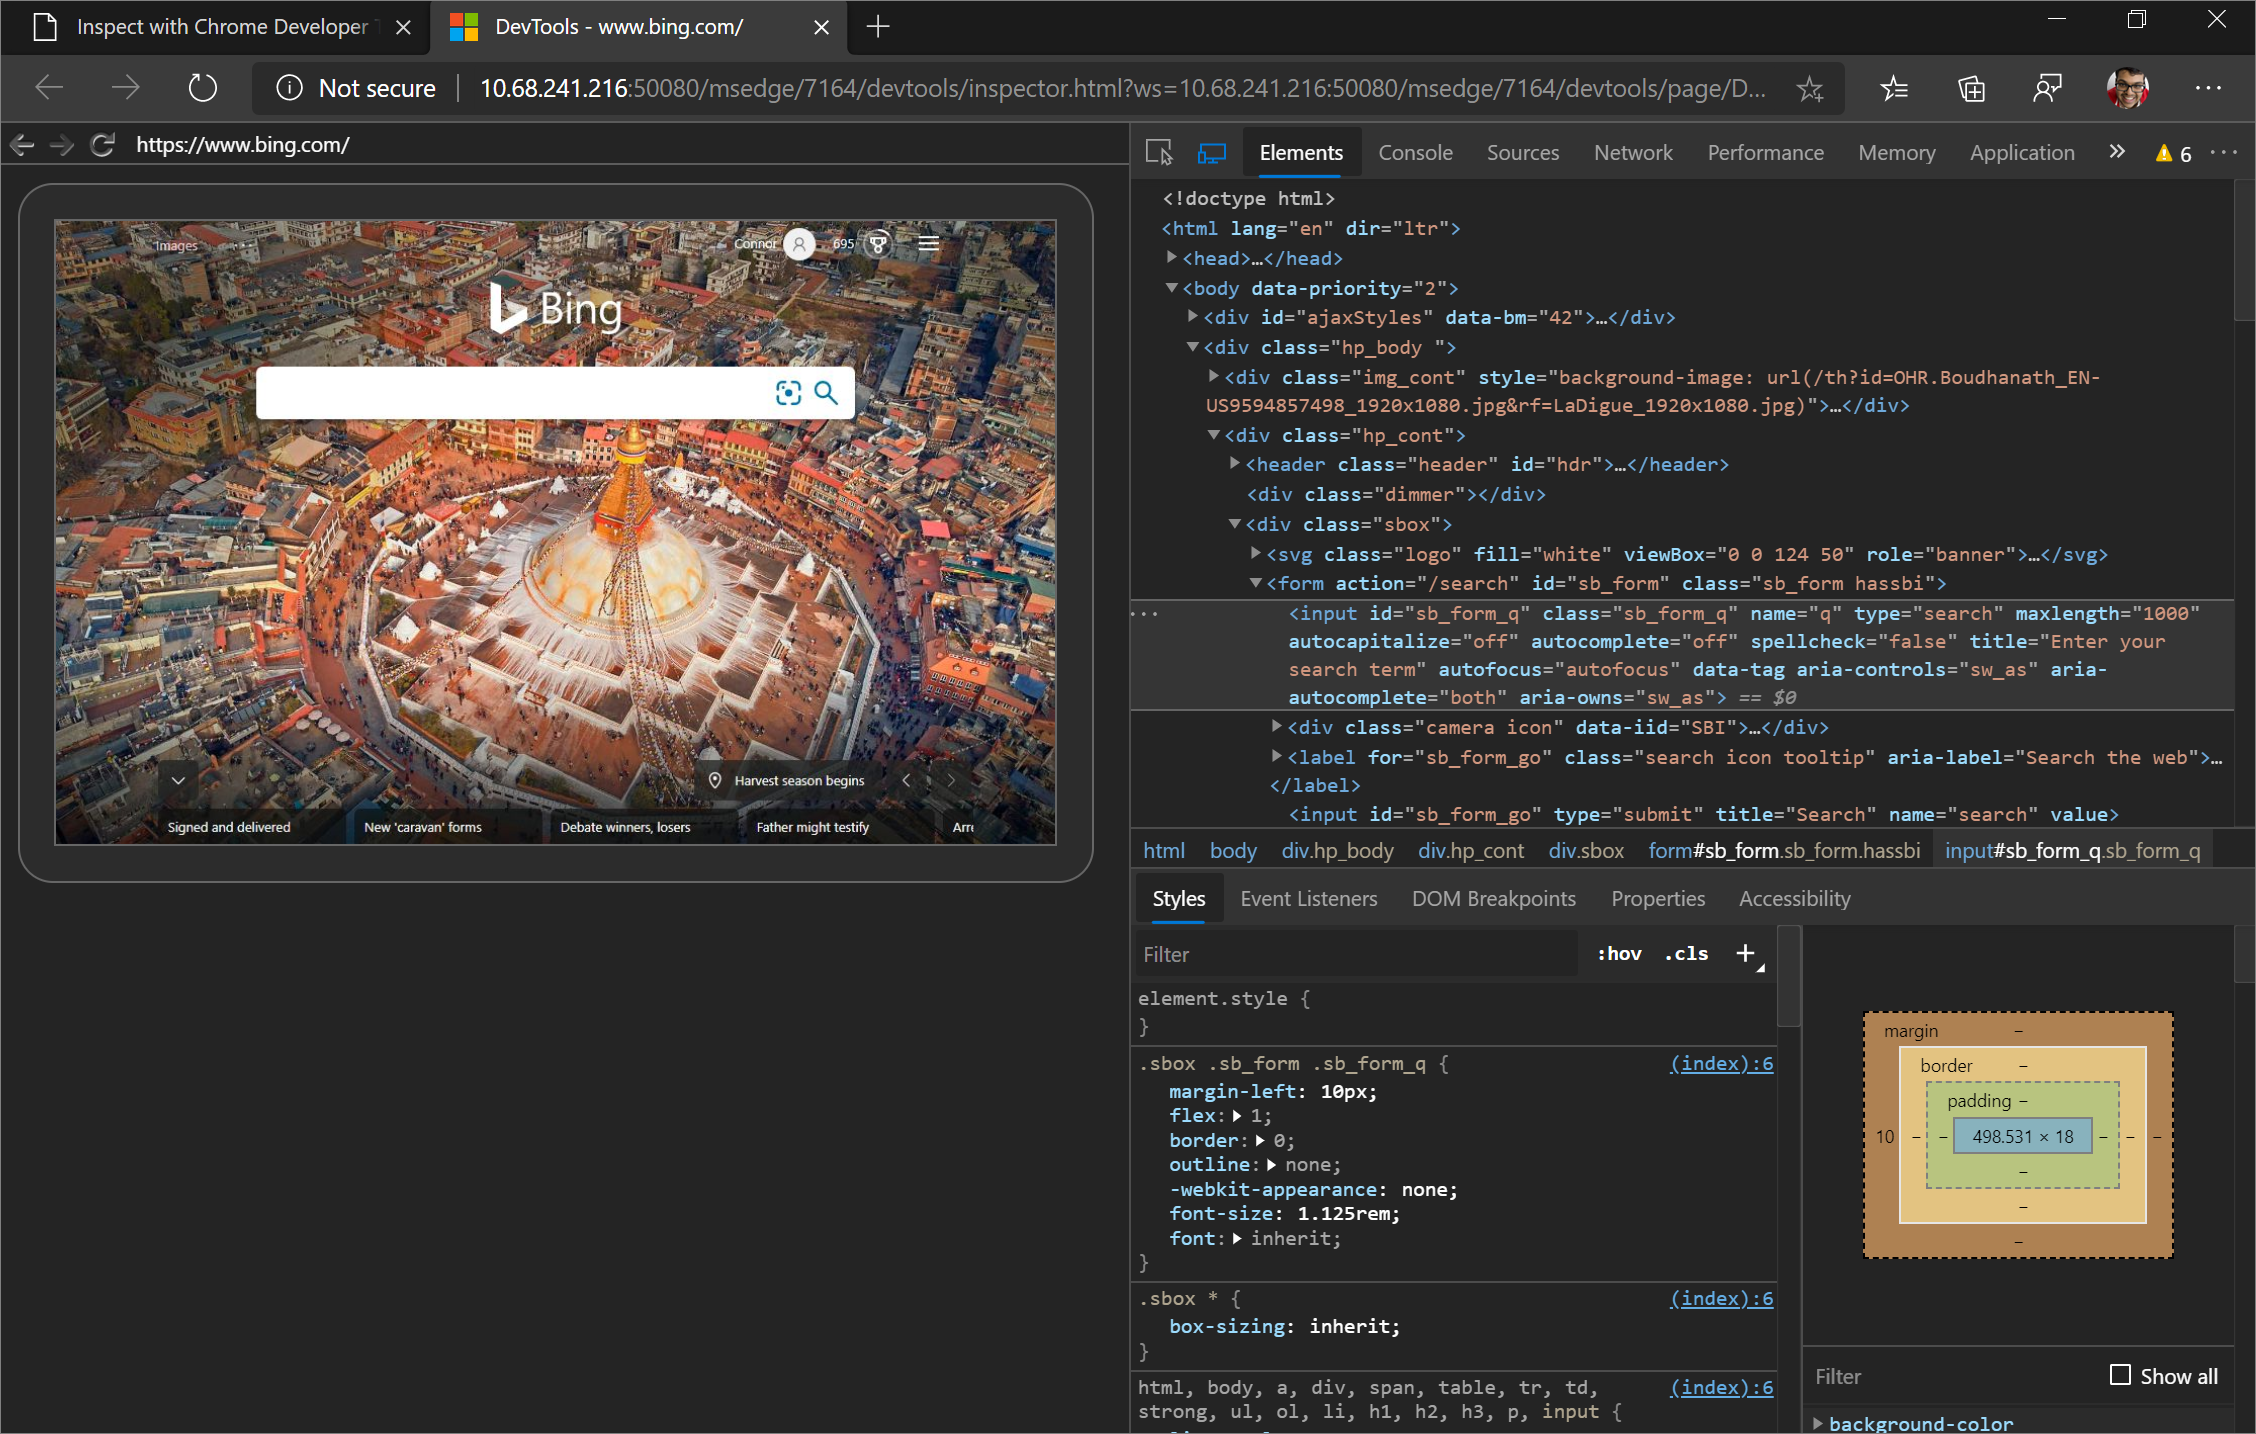
Determine the content you want to debug, and then click inspect. Microsoft Edge DevTools opens in a new tab, and screencasts the content from the host (debuggee) machine to the client (debugger) machine. You can now use the full power of Microsoft Edge DevTools on the client for content running on the host.
See also:
Inspect elements
For example, try inspecting an element. Go to the Elements tool of your DevTools instance on the client, and hover on an element to highlight it in the viewport of the host device.
You can also tap an element on your host device screen to select it in the Elements tool. Select Select Element on your DevTools instance on the client, and then tap the element on your host device screen.
Select Element is disabled after the first touch, so you need to turn it on again every time you want to use this feature.
Important
The Event Listeners pane in the Elements tool is blank on Windows 10 version 1903. This is a known issue and the team plans to fix the Event Listeners pane in a servicing update to Windows 10 version 1903.
Step 4: Screencast your host screen to your client device
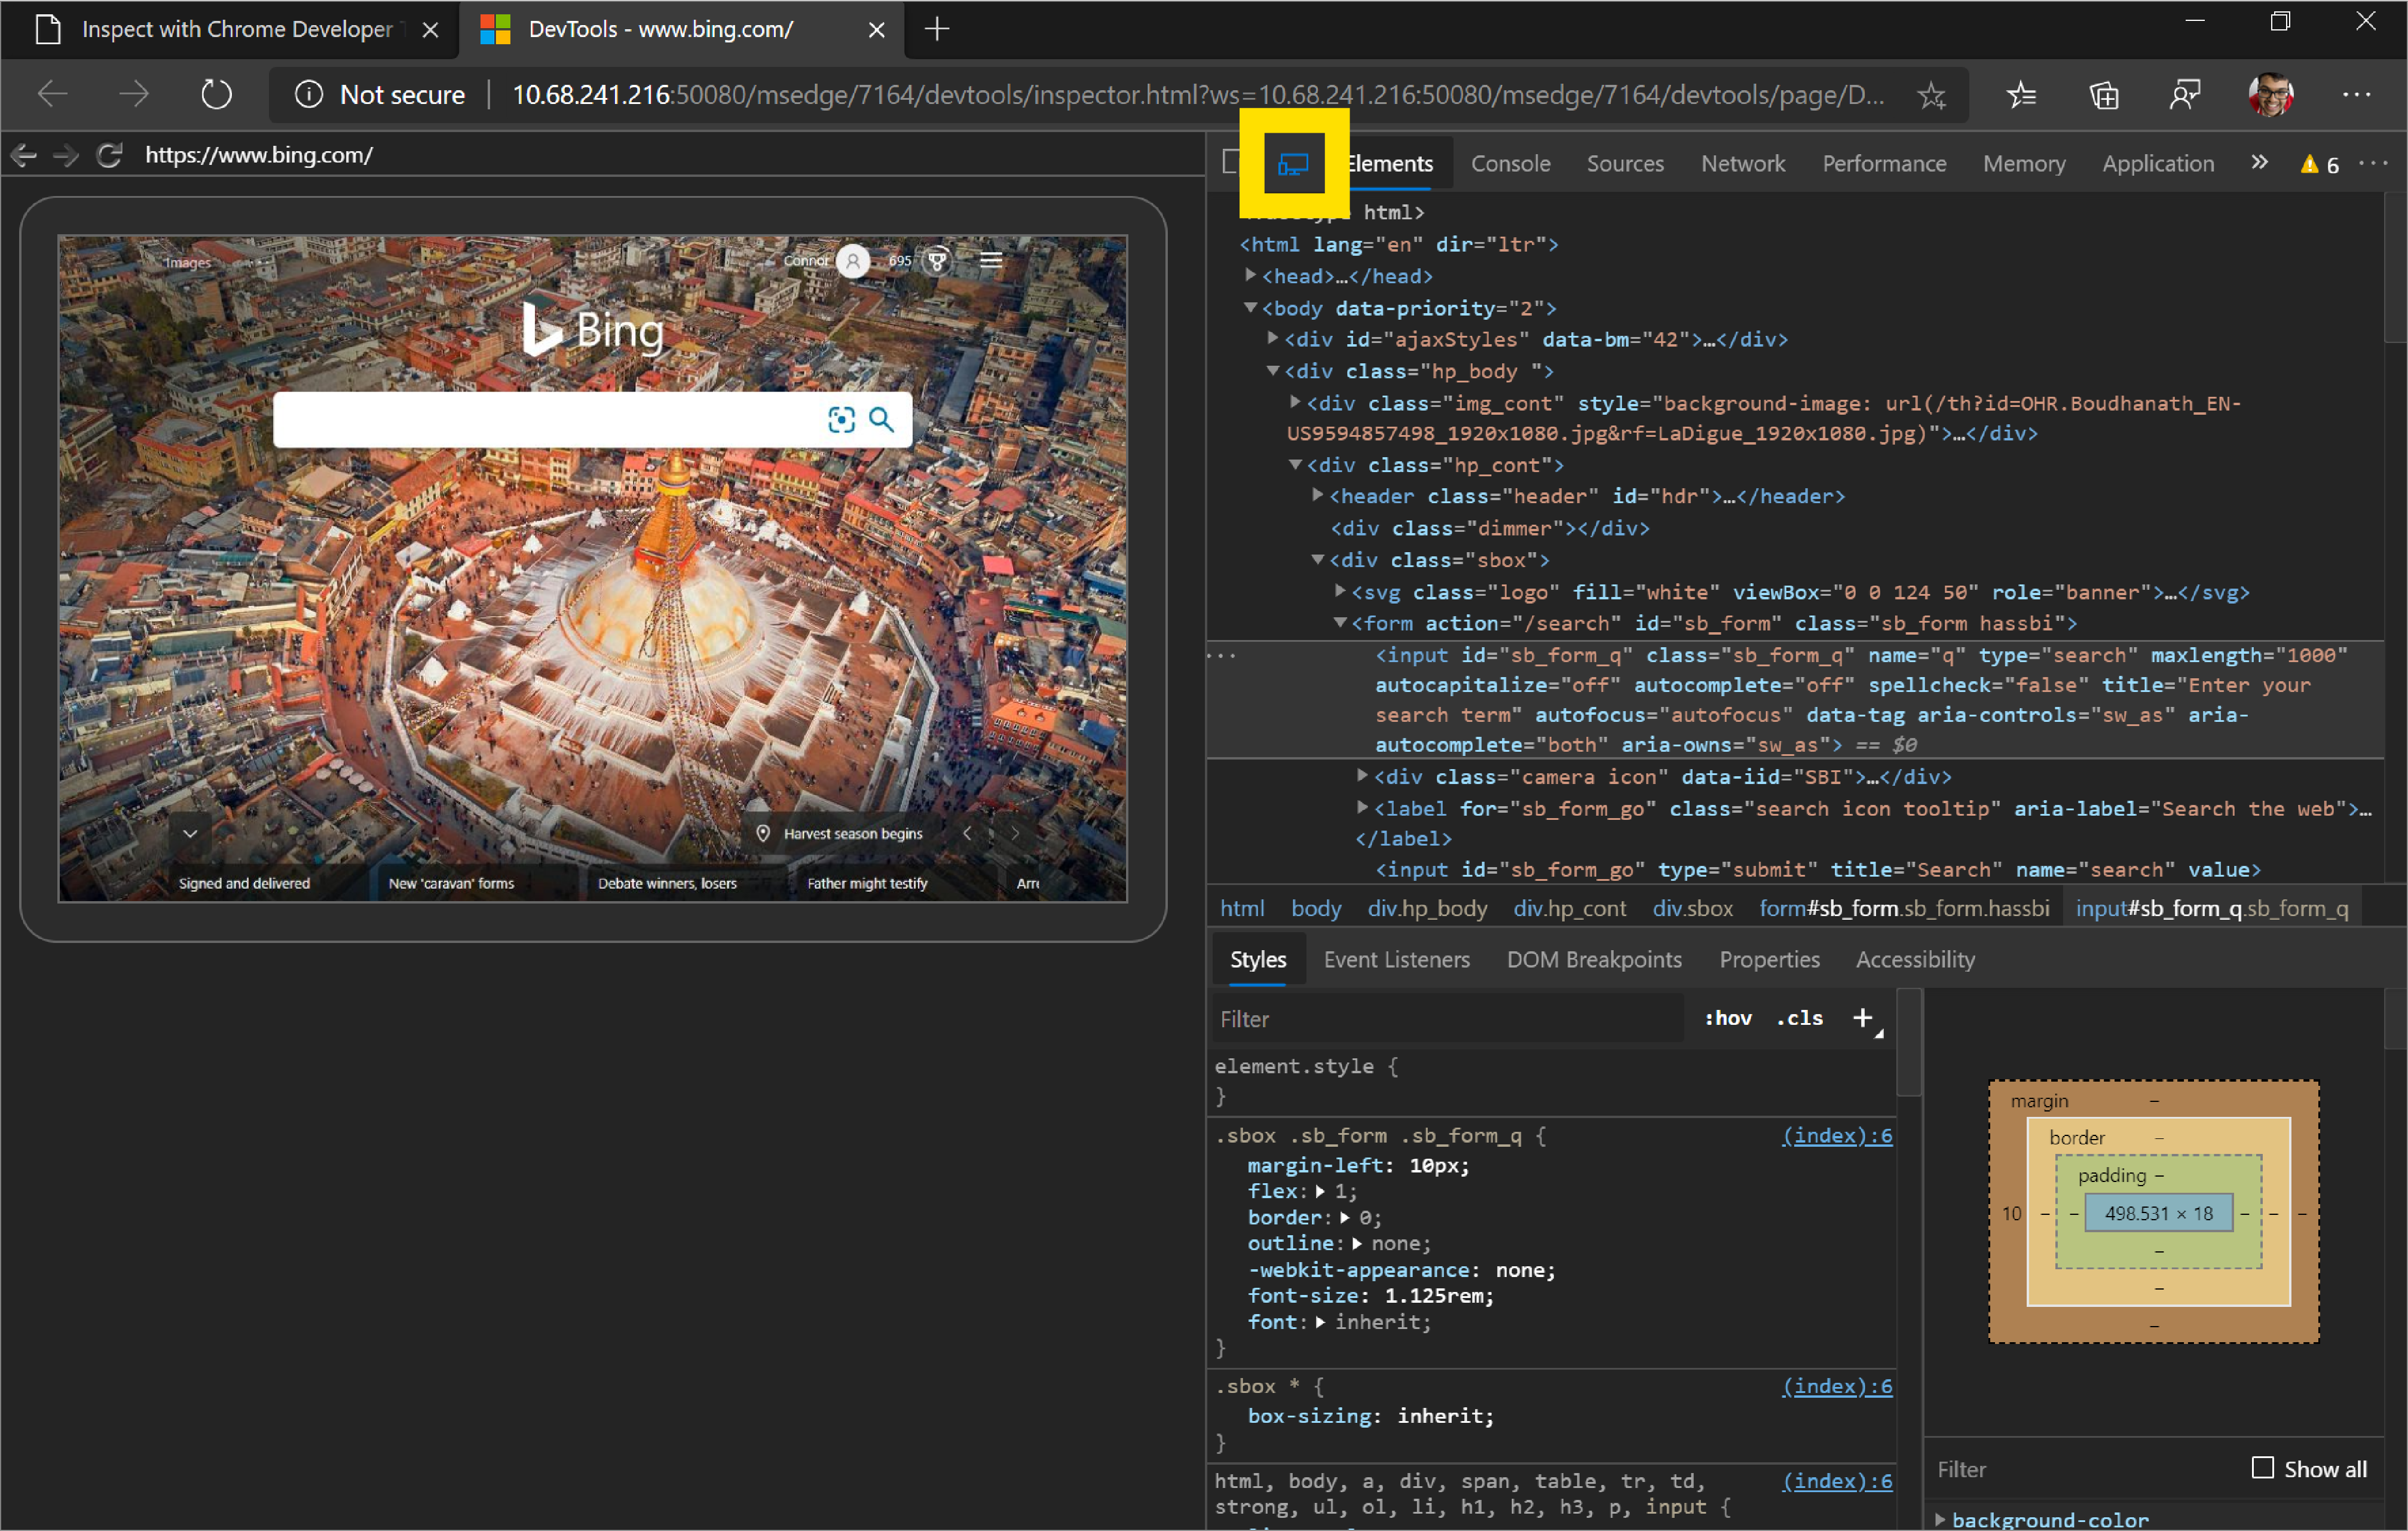
By default, the DevTools instance on the client have screencasting turned on, which allows you to view the content on the host device in your DevTools instance on your client device. Click Toggle Screencast to turn this feature on or off.
You can interact with the screencast in multiple ways:
- Clicks are translated into taps, firing proper touch events on the device.
- Keystrokes on your computer are sent to the device.
- To simulate a pinch gesture, hold Shift while dragging.
- To scroll, use your trackpad or mouse wheel, or fling with your mouse pointer.
Notes about screencasts:
Screencasts only display page content. Transparent portions of the screencast represent device interfaces, such as the Microsoft Edge Address bar, the Windows 10 or later taskbar, and the Windows 10 or later keyboard.
Screencasts negatively affect frame rates. Disable screencasting while measuring scrolls or animations to get a more accurate picture of the performance of your page.
If your host device screen locks, the content of your screencast disappears. Unlock your host device screen to automatically resume the screencast.