Note
Access to this page requires authorization. You can try signing in or changing directories.
Access to this page requires authorization. You can try changing directories.
This article provides a sample and code walkthrough for a Microsoft Edge extension that adds a tool tab and panel in DevTools.
This article first shows how to install and run the provided DevTools extension sample, which adds a Sample Panel tool tab in DevTools within Microsoft Edge. The sample is a working DevTools extension that creates its own panel, and interacts with the DevTools APIs.
This article then presents a tutorial that shows how you can optionally create that sample from scratch, and explains each step of developing the sample, and how the added code works. These tutorial steps are a good way to experience everything that's needed for typical development.
See also:
Download, install, and run the DevTools extension sample
To download, install, run, and test the provided, finished DevTools extension sample:
Download the final extension code by clicking Demos-main.zip and then extracting its content to a folder on your computer.
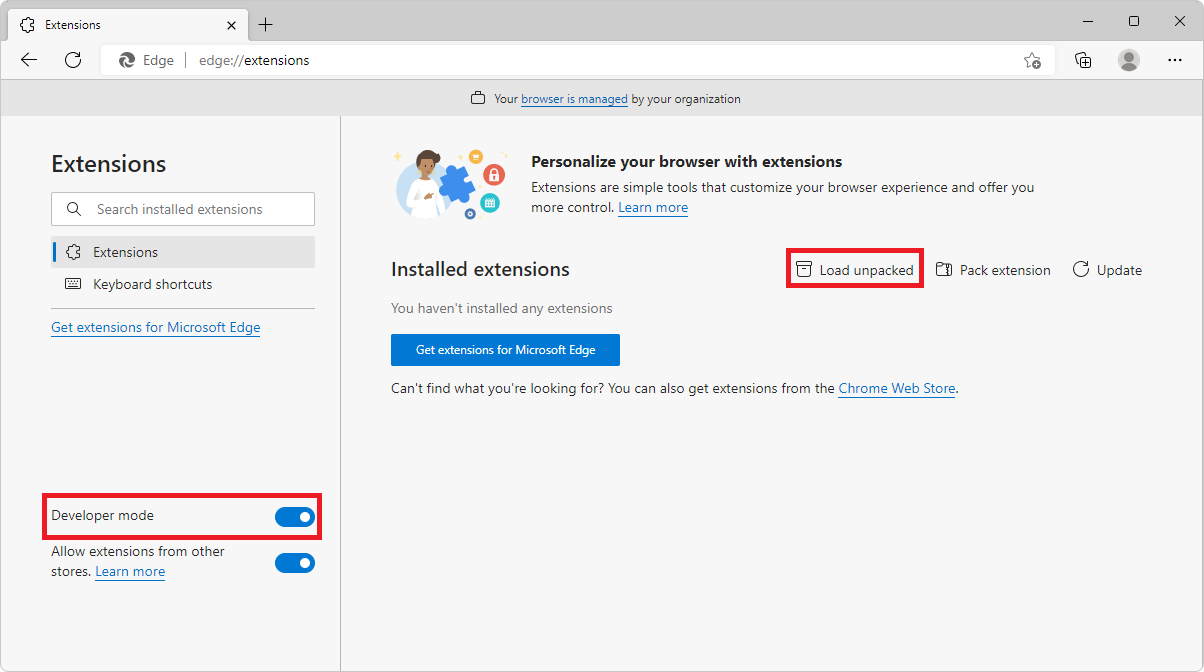
Open Microsoft Edge and go to
edge://extensions/.Turn on the Developer mode toggle.
Click Load unpacked and navigate to the folder where you extracted the zip file. In this folder, select Demos-main > devtools-extension > sample 4, and then click Select Folder.
The DevTools extension is loaded.
In Microsoft Edge, open a new tab.
Open DevTools (F12).
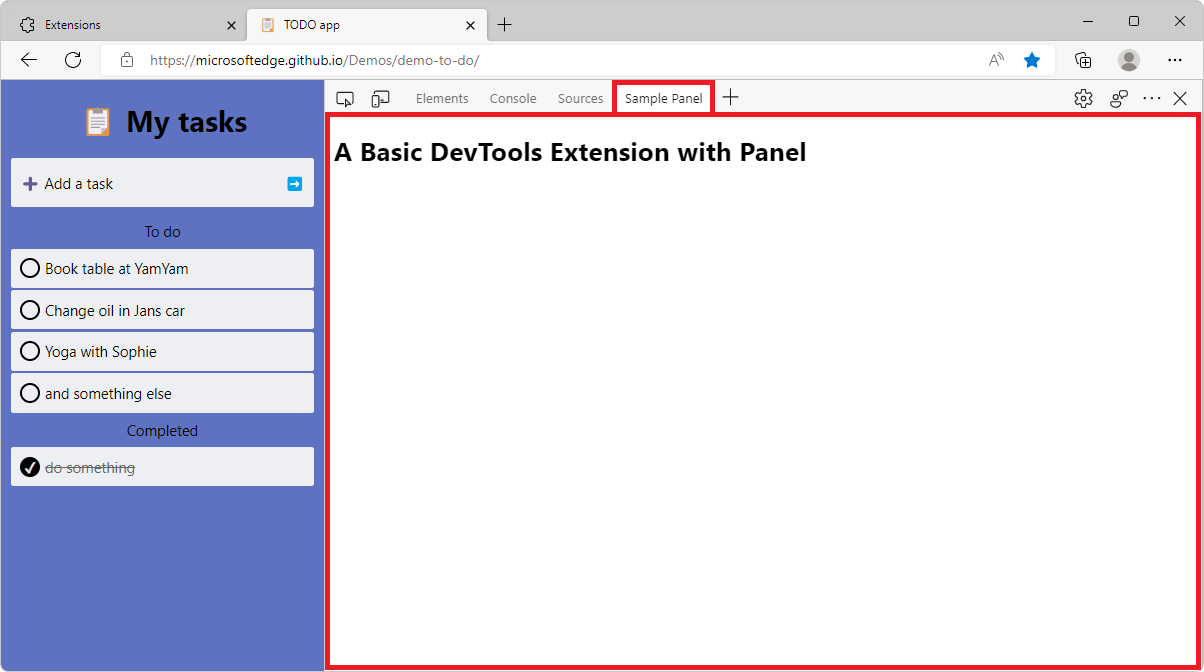
Select the Sample Panel tool (tab).
The Sample Panel tool opens:
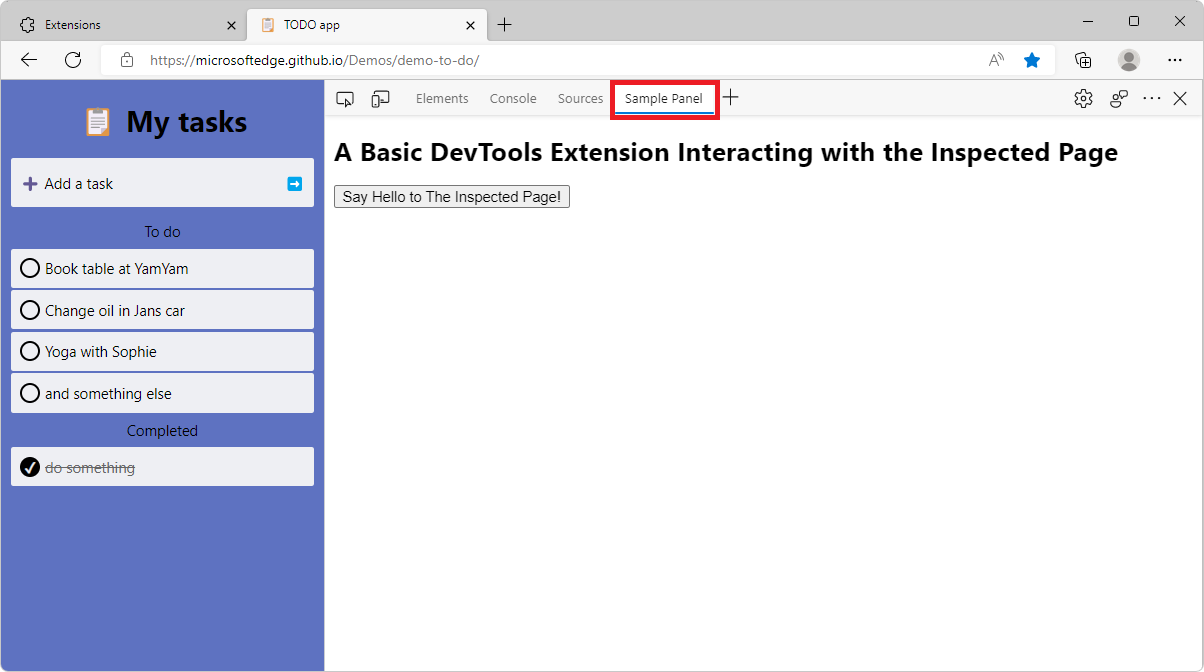
Click the Say Hello to the inspected page button.
An alert is displayed in the inspected page:
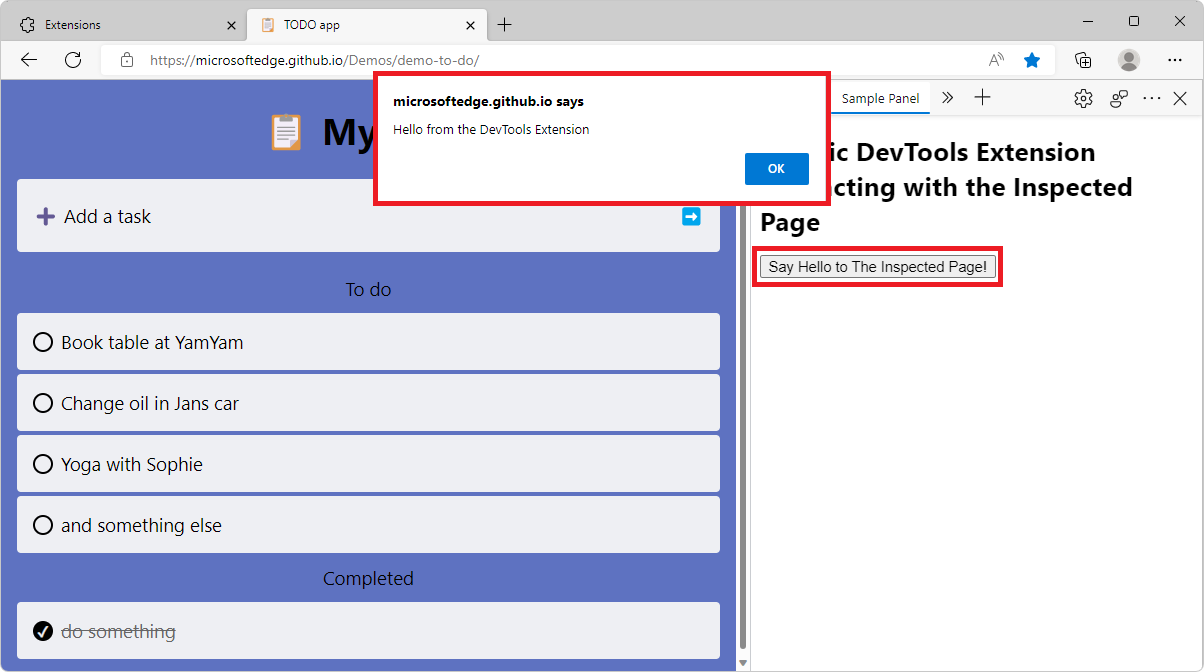
Click the OK button to close the alert.
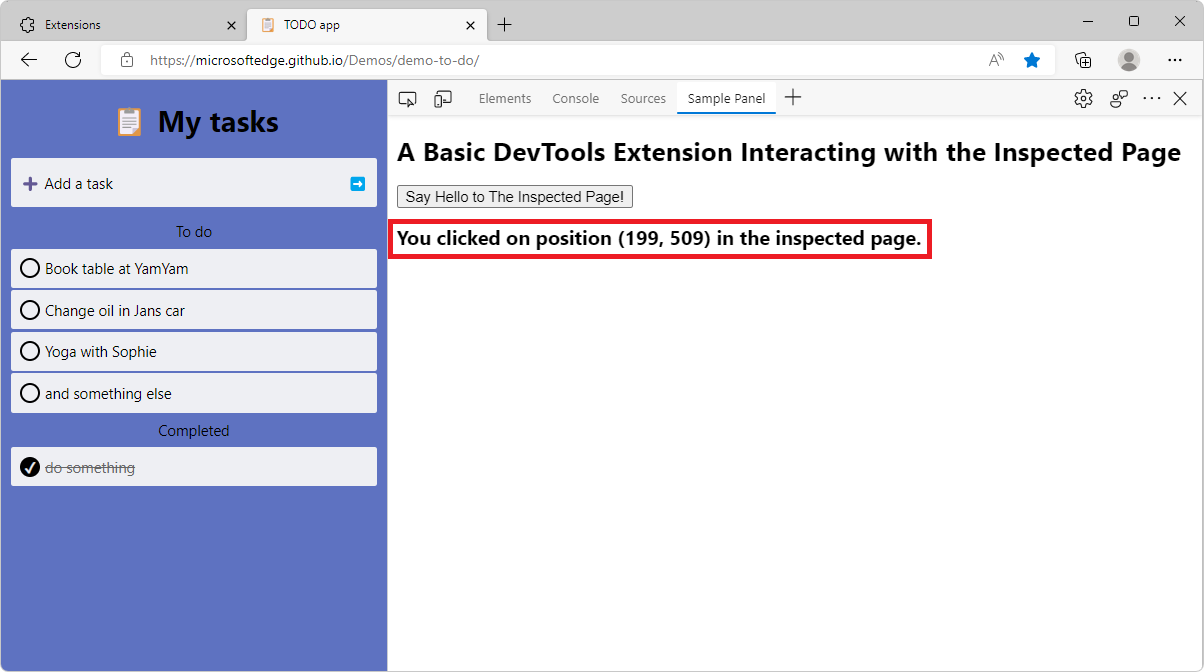
Click anywhere in the inspected page.
A message is displayed in the extension panel: You clicked on position (199, 509) in the inspected page:
Select the Console tool.
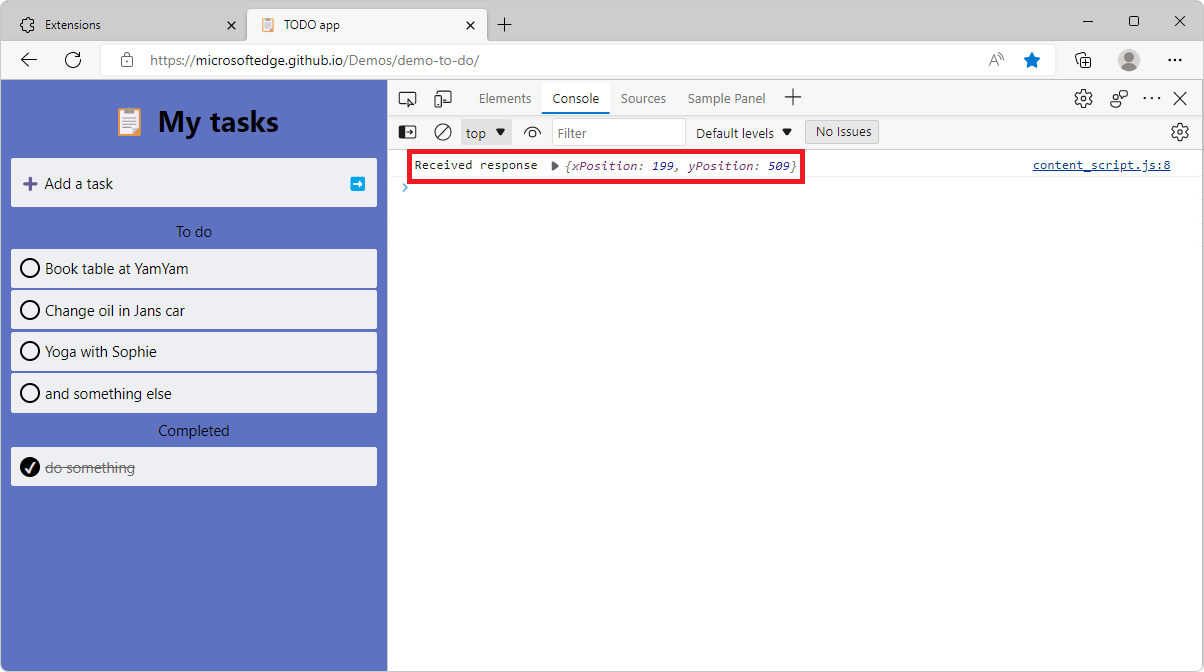
A message appears in the Console tool: Received response > {xPosition: 199, yPosition: 509}:
You downloaded, installed, ran, and tested the provided, finished DevTools extension sample. In the next steps, you create the same sample by starting from an empty directory. The following sections explain how the code works.
Step 1: Create a basic Microsoft Edge extension that has a DevTools webpage
If you want to create the files for each major step below, install a code editor such as Visual Studio Code, to follow the tutorial steps below to manually re-create the above sample DevTools extension. You can read the code walkthrough below, presented as four major steps or phases.
A basic extension for Microsoft Edge consists of a manifest file (manifest.json). Because this particular extension extends DevTools, this extension also includes a webpage file, devtools.html. The two files are provided in the Microsoft Edge / Demos repo > /devtools-extension/sample 1/ directory. The directory contains the files:
devtools.htmlmanifest.json
manifest.json
manifest.json is a manifest file, containing key/value pairs. The top-level keys are called members:
{
    "name": "DevTools Sample Extension",
    "description": "A Basic DevTools Extension",
    "manifest_version": 3,
    "version": "1.0",
    "devtools_page": "devtools.html"
}
| Member | Description |
|---|---|
name |
The name of the extension that will appear under edge://extensions/. |
description |
The description of the extension that will be displayed under the name of the extension. |
version |
The version of the extension that will appear next to the name of the extension. |
manifest_version |
Determines the set of features that the extension will be using, such as service workers or network request modification. The current version is version 3. To learn more about this version and the differences with version 2, see Overview and timelines for migrating to Manifest V3. |
devtools_page |
The path to an HTML file that's run every time DevTools is opened, and loads the extension's JavaScript files. This page isn't rendered in DevTools. |
devtools.html
devtools.html matches the devtools_page member in the manifest file:
<!DOCTYPE html>
<html>
  <head>
    <meta charset="UTF-8" />
  </head>
  <body>
    A Basic DevTools Extension.
  </body>
</html>
In a later step, you'll add a <script> element in the above file, to load a JavaScript file. This HTML file isn't displayed in DevTools.
Install and test the basic Microsoft Edge extension
Loading and testing an Edge extension locally is sometimes called sideloading an extension, as opposed to distributing an extension to users.
To load and test your basic extension locally in Microsoft Edge:
In Microsoft Edge, go to
edge://extensions/.Turn on the Developer mode toggle.
Click Load unpacked, navigate to the folder where you wrote the code for your extension, and then click the Select folder button.
Your DevTools extension is loaded.
Open a new tab.
Open DevTools (F12).
Your extension is loaded, but isn't displayed in DevTools yet, because you haven't created a panel for the extension.
See also:
Step 2: Add a custom tool in DevTools
In this step, you'll create a new panel (tool tab) in DevTools. You can either:
Copy and paste the code from the
Microsoft Edge / Demosrepo > /devtools-extension/sample 2/ directory. That directory contains the following files:devtools.htmldevtools.js- Added in Step 2.manifest.jsonpanel.html- Added in Step 2.
Copy and paste the code from the code listings below.
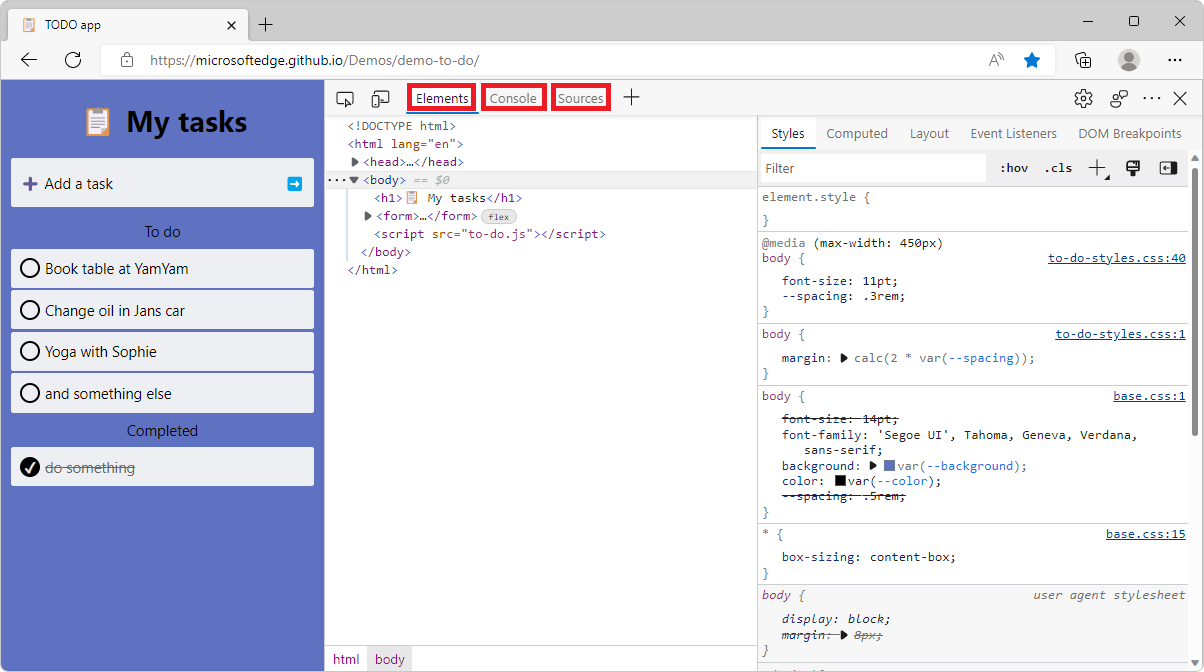
A panel is a tool tab in the main toolbar in DevTools, similar to the Elements, Console, and Sources tools shown below:
To create a basic DevTools extension with a sample panel:
Create a file named
devtools.js.Copy and paste the following code into
devtools.js:chrome.devtools.panels.create("Sample Panel", "icon.png", "panel.html", panel => { // code invoked on panel creation });The
createmethod has the following signature:chrome.devtools.panels.create( title: string, // Tool tab's label in Activity bar. iconPath: string, // Icon to display in tool's tab. pagePath: string, // Webpage to display in tool's panel. callback: function // Code to run when tool is opened. )Reference:
devtools.html:
Create a file named
devtools.html.Copy and paste the following code into
devtools.html:<!DOCTYPE html> <html> <head> <meta charset="UTF-8" /> </head> <body> <script src="devtools.js"></script> </body> </html>In the manifest file (
manifest.json), thedevtools_pagefield specifies the above file (devtools.html).devtools.html, above, contains a<script>element that loadsdevtools.js.panel.html:
Create the
panel.htmlfile that you referenced in the previouschrome.devtools.panels.createmethod call. This webpage will contain the user interface of the panel your extension is adding to DevTools.<!DOCTYPE html> <html> <head> <meta charset="UTF-8" /> </head> <body> <h1>A Basic DevTools Extension with Panel</h1> </body> </html>
Reload and test the DevTools extension
To test your changes in Microsoft Edge, reload your extension from the edge://extensions/ page:
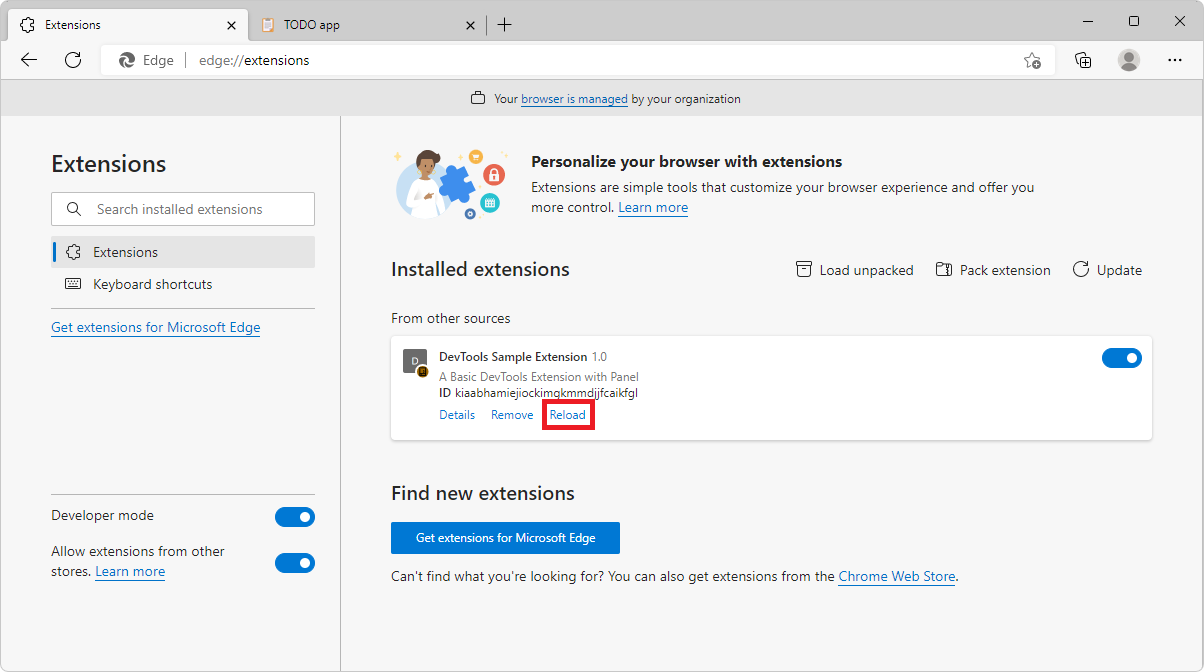
Go to
edge://extensions/.Next to the DevTools extension sample that you installed before writing your own code, click Reload:
The DevTools extension is reloaded, now using the files that you created above, rather than the provided sample that you downloaded.
Open a new tab in Microsoft Edge.
Open DevTools (F12).
In the Activity Bar, select the Sample Panel tool (tab):
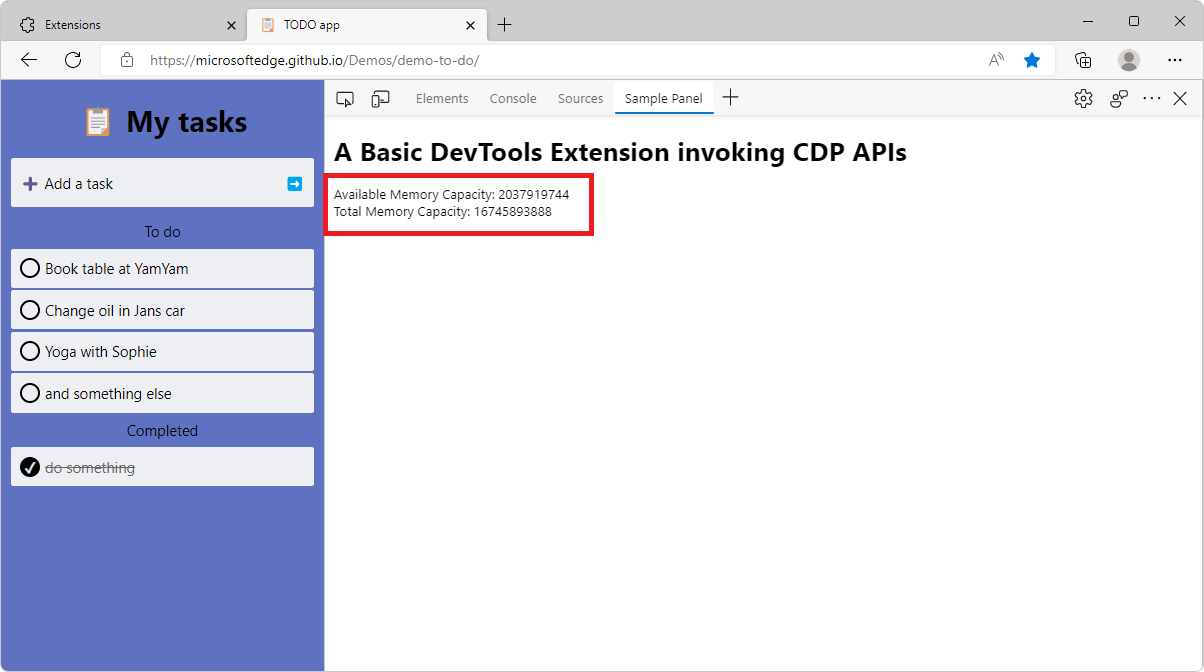
Step 3: Display memory information by calling extension APIs
In this step, you will use extension APIs to display memory information in your DevTools panel. To do this, we will need to update the permissions in the manifest file, the panel interface, and the devtools script. You can copy the source code files for this step from the Microsoft Edge / Demos repo > /devtools-extension/sample 3/ directory, or create the files yourself by following the instructions below. The directory contains the files:
devtools.htmldevtools.js- Updated in Step 3.manifest.json- Updated in Step 3.panel.html- Updated in Step 3.
Use the
permissionsmanifest member in yourmanifest.jsonfile. This member defines which permissions your extension requires from the user. Some permissions are needed to use certain extension APIs."permissions": [ "system.memory", ]The
system-memorypermission is required, in order to use the extension APIs that you'll use later in this tutorial. To learn more about the available APIs and associated permissions, see Reference for extension APIs.panel.html:
Add the following to the body in the
panel.htmlfile to display the data in the panel.<div> Available Memory Capacity: <span id="availableMemoryCapacity"></span> </div> <div> Total Memory Capacity: <span id="totalMemoryCapacity"></span> </div>devtools.js:
Update the
devtools.jsfile with the following code.let availableMemoryCapacity; let totalMemoryCapacity; chrome.devtools.panels.create("Sample Panel", "icon.png", "panel.html", panel => { // code invoked on panel creation panel.onShown.addListener((extPanelWindow) => { availableMemoryCapacity = extPanelWindow.document.querySelector('#availableMemoryCapacity'); totalMemoryCapacity = extPanelWindow.document.querySelector('#totalMemoryCapacity'); }); }); setInterval(() => { chrome.system.memory.getInfo((data) => { if (availableMemoryCapacity) { availableMemoryCapacity.innerHTML = data.availableCapacity; } if (totalMemoryCapacity) { totalMemoryCapacity.innerHTML = data.capacity; } }); }, 1000);
The above code snippet does the following:
Creates a new panel
Sample Panelin DevTools.When the panel is displayed (
panel.onShownlistener), theavailableMemoryCapacityandtotalMemoryCapacityelements are retrieved from the DOM.Sets a timer to run code every second after the panel is shown.
When the timer fires, the
chrome.system.memory.getInfomethod is used to retrieve the available and total memory capacity of the device and these values are displayed in the corresponding DOM elements.
Reload and test the DevTools extension
To test your changes in Microsoft Edge, reload your extension from the edge://extensions/ page:
Go to
edge://extensions/.Next to your DevTools extension, click Reload.
Your DevTools extension is reloaded.
Open a new tab.
Open DevTools (F12).
Select the Sample Panel tool.
Your DevTools extension shows the available and total memory capacities:
See also:
Step 4: Interact between the webpage and DevTools
In this step of the tutorial, you will add code that interacts with the inspected webpage. That code will:
- Listen to click events that happen on the webpage and log them into the DevTools Console tool.
- Display the mouse click position in the DevTools extension panel.
- When the user clicks a button in the DevTools extension panel, display a greeting alert in the inspected webpage.
You can copy the files that are the end result of this step from the Microsoft Edge / Demos repo > /devtools-extension/sample 4/ directory, or create the files yourself by following the instructions below. The directory contains the files:
background.js- added in Step 4.content_script.js- added in Step 4.devtools.htmldevtools.js- updated in Step 4.manifest.json- updated in Step 4.panel.html- updated in Step 4.
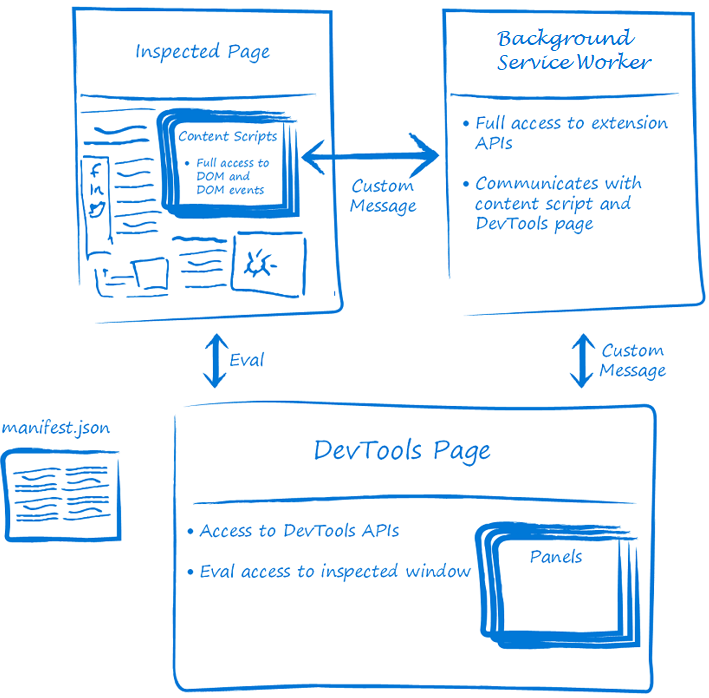
The DevTools tool (panel) that you created so far doesn't have direct access to the inspected webpage, and doesn't run until DevTools is opened. For this you will use a content script and a background service worker.
- A content script runs in the context of the inspected webpage. In the same way that other scripts are loaded by the webpage, a content script has have access to the DOM and can change it.
- A background service worker is a script that the browser runs in a separate thread. This script has access to the Microsoft Edge extension APIs.
The DevTools page, inspected page, content script, and background service worker fit together in an extension:
In this part of the tutorial, you'll detect the user clicks on a webpage by using a content script. The content script will relay this info to the devtools.js file, where the data will be displayed in both the console and the DevTools extension panel.
Append the following code in the
manifest.jsonfile:"content_scripts": [{ "matches": [ "http://*/*", "https://*/*" ], "run_at": "document_idle", "js": [ "content_script.js" ] }], "background": { "service_worker": "background.js" }Key Value matchesSpecifies which pages this content script will be injected into. run_atIndicates when the browser injects the script onto the page. jsThe javascript files to be injected. content_script.js:
Create a file named
content_script.js.Copy and paste the following code into
content_script.js:document.addEventListener("click", (event) => { chrome.runtime.sendMessage({ click: true, xPosition: event.clientX + document.body.scrollLeft, yPosition: event.clientY + document.body.scrollTop }, response => { console.log("Received response", response); } ); });The above code snippet prints a message to the console when the script is injected in the page. It also adds a click event listener to the page that will send a message with mouse click position in the inspected page by using the
chrome.runtime.sendMessageAPI.panel.html:
In the
panel.htmlfile, add asayHellobutton and ayouClickedOnlabel, as follows:<button id="sayHello">Say Hello to the inspected page!</button> <h2><span id="youClickedOn"></span></h2>The above two elements are used to demo the interaction between the inspected page, the DevTools panel, and the background service worker. When the user clicks the
sayHellobutton in the DevTools extension, it will display a greeting message in the inspected window. When the user clicks anywhere in the inspected page, it will display a message to show the mouse click position in the DevTools extension panel.devtools.js:
In the
devtools.jsfile (as shown below), use thechrome.runtime.connectmethod to create a connection to the background service worker, and then send the inspected windowtabIdto the service worker by using thebackgroundPageConnection.postMessagemethod. Finally, add event listeners to thesayHellobutton andyouClickedOnlabel that's defined in thepanel.htmlfile, as shown below:let youClickedOn; chrome.devtools.panels.create("Sample Panel", "icon.png", "panel.html", panel => { // code invoked on panel creation panel.onShown.addListener( (extPanelWindow) => { let sayHello = extPanelWindow.document.querySelector('#sayHello'); youClickedOn = extPanelWindow.document.querySelector('#youClickedOn'); sayHello.addEventListener("click", () => { // show a greeting alert in the inspected page chrome.devtools.inspectedWindow.eval('alert("Hello from the DevTools extension");'); }); }); }); chrome.runtime.onMessage.addListener((request, sender, sendResponse) => { // Messages from content scripts should have sender.tab set if (sender.tab && request.click == true) { console.log('I am here!'); if (youClickedOn) { youClickedOn.innerHTML = `You clicked on position (${request.xPosition}, ${request.yPosition}) in the inspected page.`; } sendResponse({ xPosition: request.xPosition, yPosition: request.yPosition }); } }); // Create a connection to the background service worker const backgroundPageConnection = chrome.runtime.connect({ name: "devtools-page" }); // Relay the tab ID to the background service worker backgroundPageConnection.postMessage({ name: 'init', tabId: chrome.devtools.inspectedWindow.tabId });When the user clicks the
sayHellobutton, the DevTools extension will run a code snippet ofalert("Hello from the DevTools Extension");in the inspected window by invoking theeval()method of the inspected windowchrome.devtools.inspectedWindow.When the user clicks anywhere in the inspected window, the DevTools extension will receive a message, from the background service worker, with
request.click == trueand the mouse position information.background.js:
Create a file named
background.js.Copy and paste the following code into
background.js:let id = null; const connections = {}; chrome.runtime.onConnect.addListener(devToolsConnection => { // Assign the listener function to a variable so we can remove it later let devToolsListener = (message, sender, sendResponse) => { if (message.name == "init") { id = message.tabId; connections[id] = devToolsConnection; // Send a message back to DevTools connections[id].postMessage("Connected!"); } }; // Listen to messages sent from the DevTools page devToolsConnection.onMessage.addListener(devToolsListener); devToolsConnection.onDisconnect.addListener(() => { devToolsConnection.onMessage.removeListener(devToolsListener); }); });The above code connects the background service worker with the DevTools page. It listens to when the DevTools page connects, saves the connection, and sends a response back to the DevTools page.
This is useful when your background service worker is collecting data or performing tasks in the background that you want to be available in your DevTools extension.
Reload and test the DevTools extension
To test the new sayHello button:
Go to
edge://extensions/.Find the unpacked extension entry that you loaded in Step 1.
Click the Reload button.
Open a new browser tab, open DevTools (F12), and then click the Sample Panel tool (tab).
Click the Say Hello to The Inspected Page! button.
An alert is displayed in the inspected page:
Click the OK button to close the alert.
Click anywhere in the inspected page.
A message is displayed in the extension panel: You clicked on position (199, 509) in the inspected page:
Select the Console tool.
A message appears in the Console tool: Received response > {xPosition: 199, yPosition: 509}:
This completes the tutorial and code walkthrough for creating a DevTools extension that adds a tool tab and panel in DevTools in Microsoft Edge.
See also:
See also
- Overview of DevTools
- Samples for Microsoft Edge extensions
- Overview and timelines for migrating to Manifest V3
- Sideload an extension to install and test it locally
developer.chrome.com:
GitHub:
- Demos-main.zip - Downloads the MicrosoftEdge > Demos repo, rather than cloning it.
- /devtools-extension/ - Source code of the sample.
- /devtools-extension/sample 1/ - Phase 1 of the sample.
- /devtools-extension/sample 2/ - Phase 2 of the sample.
- /devtools-extension/sample 3/ - Phase 3 of the sample.
- /devtools-extension/sample 4/ - Phase 4 of the sample.
Tools: