Note
Access to this page requires authorization. You can try signing in or changing directories.
Access to this page requires authorization. You can try changing directories.
Chrome DevTools for agents (chrome-devtools-mcp) lets your coding agent (such as Copilot, Antigravity, Claude, or Cursor) control and inspect a live Chromium-based browser, including Microsoft Edge and WebView2.
Detailed contents:
- Introduction
- Prerequisites
- Launch Edge
- Auto-connect to a running Edge instance
- Auto-connect to a WebView2 instance
- How it works
- Configuring other MCP clients
- Troubleshooting
- See also
Introduction
Chrome DevTools for agents (chrome-devtools-mcp) lets your coding agent (such as Copilot, Antigravity, Claude, or Cursor) control and inspect a live Chromium-based browser, including Microsoft Edge and WebView2.
Chrome DevTools for agents acts as a Model-Context-Protocol (MCP) server, giving your AI coding assistant access to the full power of Microsoft Edge DevTools for reliable automation, in-depth debugging, and performance analysis.
The Chrome DevTools MCP server supports connecting to any Chromium-based browser, including Microsoft Edge and WebView2. Because the server is built for the Google Chrome browser, you need to provide extra configuration to point the server at Microsoft Edge or a WebView2 instance.
This guide covers three scenarios:
- Launch Edge — the MCP server starts Microsoft Edge for you.
- Auto-connect to a running Edge instance — you start Edge yourself and the MCP server connects to it.
- Auto-connect to a WebView2 instance — the MCP server connects to a running WebView2 host app.
See also:
- Chrome DevTools for agents - the "ChromeDevTools / chrome-devtools-mcp" repo.
Prerequisites
- Node.js, the latest Long-Term Support (LTS) release.
- npm.
- Microsoft Edge installed (any channel: Stable, Beta, Dev, or Canary).
- A coding agent with Model-Context-Protocol (MCP) support, such as Microsoft Visual Studio Code (with GitHub Copilot), Copilot CLI, Claude Code, or Cursor.
The examples in this guide use the VS Code mcp.json format. If you're using a different MCP client, see Configuring other MCP clients, below.
Launch Edge
Use this configuration to let your coding agent launch Microsoft Edge for you.
With this configuration, the Model-Context-Protocol (MCP) server, which your agent connects to, launches Edge, by using the --executablePath flag pointing to the Edge binary.
Copy and paste the configuration snippet for your platform into your VS Code mcp.json. These examples use Edge Stable.
{
  "servers": {
    "chrome-devtools": {
      "type": "stdio",
      "command": "npx",
      "args": [
        "-y",
        "chrome-devtools-mcp@latest",
        "--executablePath=%ProgramFiles(x86)%\\Microsoft\\Edge\\Application\\msedge.exe"
      ]
    }
  }
}
Additional flags for launching Edge
You can combine --executablePath with the following flags:
--headless— run without a visible browser window--isolated— use a temporary profile directory (cleaned up on close)--viewport=1280x720— set initial viewport size
Example with headless and isolated (Windows):
"args": [
  "-y",
  "chrome-devtools-mcp@latest",
  "--executablePath=%ProgramFiles(x86)%\\Microsoft\\Edge\\Application\\msedge.exe",
  "--headless",
  "--isolated"
]
Executable path for each Edge channel
Use the appropriate --executablePath value for your channel of Edge.
These are default install locations. Paths may vary based on user configuration, version, or group policies.
| Channel | Default Path |
|---|---|
| Stable | %ProgramFiles(x86)%\Microsoft\Edge\Application\msedge.exe |
| Beta | %ProgramFiles(x86)%\Microsoft\Edge Beta\Application\msedge.exe |
| Dev | %ProgramFiles(x86)%\Microsoft\Edge Dev\Application\msedge.exe |
| Canary | %LOCALAPPDATA%\Microsoft\Edge SxS\Application\msedge.exe |
Auto-connect to a running Edge instance
Use the configuration below to automatically connect to an instance of Microsoft Edge that's already running.
Auto-connecting to an already running Edge instance is useful:
- When you want to maintain browser state between manual testing and agent-driven testing.
- When you need to be signed into a website.
- For example, when you need to be signed into a website that has a complex authentication flow that's hard to accomplish with traditional web automation.
- When you want to inspect an existing session.
Warning
When using auto-connect, your agent inherits your active session, including logged-in accounts, cookies, and other data that's surfaced through JavaScript APIs. This may expose Personally Identifiable Information (PII) to the agent. Only use this mode with agents that you trust, and be careful with your prompts.
Step 1: Enable remote debugging in Edge
There are have two options:
Option A: Start Microsoft Edge with the remote debugging flag:
msedge.exe --remote-debugging-port=9222
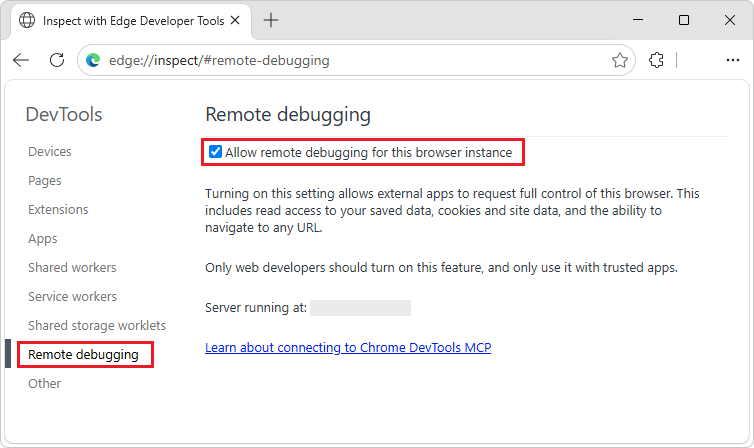
Option B: In the Inspect with Edge Developer Tools special page, enable remote debugging, as follows:
In a running instance of Microsoft Edge, go to
edge://inspect.The Inspect with Edge Developer Tools page opens, initially showing the Devices page.
On the left, click Remote debugging.
The Remote debugging page opens.
Select the Allow remote debugging for this browser instance checkbox:
Step 2: Configure the MCP server
To configure the Model-Context-Protocol (MCP) server, use --autoConnect combined with --user-data-dir pointing to your Microsoft Edge user data directory. These examples use the Edge Stable channel.
{
  "servers": {
    "chrome-devtools": {
      "type": "stdio",
      "command": "npx",
      "args": [
        "-y",
        "chrome-devtools-mcp@latest",
        "--autoConnect",
        "--user-data-dir=%LocalAppData%\\Microsoft\\Edge\\User Data"
      ]
    }
  }
}
Step 3: Test your setup
Make sure Microsoft Edge is running, then enter the following prompt in your Model-Context-Protocol (MCP) client:
Navigate to https://contoso.com and take a screenshot
The MCP server should connect to your running Edge instance and execute the command.
User data directory for each Edge channel
Use the appropriate --user-data-dir value for your channel.
These are default locations. Paths may vary based on user configuration, version, or group policies.
| Channel | Default Path |
|---|---|
| Stable | %LOCALAPPDATA%\Microsoft\Edge\User Data |
| Beta | %LOCALAPPDATA%\Microsoft\Edge Beta\User Data |
| Dev | %LOCALAPPDATA%\Microsoft\Edge Dev\User Data |
| Canary | %LOCALAPPDATA%\Microsoft\Edge SxS\User Data |
Auto-connect to a WebView2 instance
WebView2 doesn't have a "launch" scenario; instead, the host app creates the WebView2 instance.
The MCP server connects to the WebView2 instance via auto-connect, similar to Auto-connect to a running Edge instance, above.
Step 1: Enable remote debugging for WebView2
You need to configure the WebView2 runtime to start with --remote-debugging-port=0. There are two ways to do this: WebView2Utilities, or Windows Registry.
By using WebView2Utilities
Many apps will block the end user from opening DevTools. As a developer, you can use WebView2Utilities to auto-open DevTools when a WebView2 is created, as follows.
In WebView2Utilities, select the Overrides tab.
Click the Add New button in the lower left.
Select the newly added entry in the list.
Change the Host app exe textbox to be the name of the executable file of your host app, such as
OUTLOOK.EXE.In the Browser arguments section, in the Arguments textbox, enter:
--remote-debugging-port=0If your host app is running, close your host app.
Restart your host app.
When the host app creates a WebView2, it now automatically opens DevTools.
See also:
By using the Windows Registry
In this approach, you create a registry value to set AdditionalBrowserArguments. Replace appname.exe with the name of your WebView2 host executable:
[HKEY_CURRENT_USER\Software\Policies\Microsoft\Edge\WebView2\AdditionalBrowserArguments]
"appname.exe"="--remote-debugging-port=0"
For information about additionalBrowserArguments and WEBVIEW2_ADDITIONAL_BROWSER_ARGUMENTS, see Globals in WebView2 Win32 API Reference.
Step 2: Find the WebView2 user data directory
You need to discover the user data directory of the host app.
The path for the user data directory ends with \EBWebView. The \EBWebView suffix is automatically added by the WebView2 Runtime. If you're copying the user data path from source code, you might need to append \EBWebView.
You can find the path for the user data directory by using WebView2Utilities: in the Host Apps tab, select your running host app, and examine the User data folder row.
Step 3: Configure the MCP server
To configure the Model-Context-Protocol (MCP) server, use --autoConnect combined with --user-data-dir pointing to the WebView2 user data directory:
{
  "servers": {
    "chrome-devtools": {
      "type": "stdio",
      "command": "npx",
      "args": [
        "-y",
        "chrome-devtools-mcp@latest",
        "--autoConnect",
        "--user-data-dir=%LocalAppData%\\Packages\\<APP_PACKAGE>\\LocalState\\EBWebView"
      ]
    }
  }
}
Replace <APP_PACKAGE> with the package name of your host app.
Step 4: Test your setup
Launch your WebView2 host app, then use your MCP client to interact with your WebView2 host app.
For example, prompt your AI coding agent: Take a snapshot of the current page
How it works
Under the hood, the Chrome DevTools MCP server uses Puppeteer to control the browser. When you provide --executablePath, Puppeteer launches that binary directly, instead of searching for the browser.
When you provide --autoConnect with --user-data-dir, the server reads the DevToolsActivePort file from that directory to discover the WebSocket endpoint of the running browser and connects to it.
Because Microsoft Edge and WebView2 are based on the Chromium browser engine, the DevTools Protocol is compatible with Microsoft Edge and WebView2, and the MCP tools work as expected.
Configuring other MCP clients
The examples above use the Visual Studio Code mcp.json format. Here's how to adapt the above examples for other Model-Context-Protocol (MCP) clients:
Copilot CLI
Copilot CLI stores its config in ~/.copilot/mcp-config.json. The format uses mcpServers (instead of servers) and "type": "local" (instead of "type": "stdio"):
{
  "mcpServers": {
    "chrome-devtools": {
      "type": "local",
      "command": "npx",
      "args": [
        "-y",
        "chrome-devtools-mcp@latest",
        "--executablePath=%ProgramFiles(x86)%\\Microsoft\\Edge\\Application\\msedge.exe"
      ]
    }
  }
}
You can also add an MCP server interactively by running copilot and then /mcp add.
Other MCP clients, such as Claude Code, Cursor, or Gemini CLI
Most Model-Context-Protocol (MCP) clients use the generic mcpServers format without a type field:
{
  "mcpServers": {
    "chrome-devtools": {
      "command": "npx",
      "args": [
        "-y",
        "chrome-devtools-mcp@latest",
        "--executablePath=%ProgramFiles(x86)%\\Microsoft\\Edge\\Application\\msedge.exe"
      ]
    }
  }
}
The args array is the same across all clients; only the wrapper format differs. See your MCP client's documentation for the exact config file location and format.
Troubleshooting
"Could not connect to Chrome" error with auto-connect
If you are using auto-connect and get an error such as "Could not connect to Chrome":
Make sure Microsoft Edge is running, and remote debugging is enabled.
Make sure the
--user-data-dirpath is correct for your channel of Microsoft Edge.Make sure the
DevToolsActivePortfile exists in the user data directory. TheDevToolsActivePortfile is created when remote debugging is active.
Edge not found at executablePath
Make sure that the
executablePathfor the channel of Microsoft Edge exists on disk. For example, Edge Canary on Windows installs per-user under%LOCALAPPDATA%, not under\Program Files\.On Windows, use double backslashes (
\\) in JSON strings.
WebView2 won't connect
Make sure the registry key matches your host app's executable name exactly.
After adding the
AdditionalBrowserArgumentsregistry key, restart the host app. The app name.exeargument is only read at WebView2 creation time.Make sure the
--user-data-dirpath ends with\EBWebView.
See also
GitHub:
- Chrome DevTools for agents - the README of the "ChromeDevTools / chrome-devtools-mcp" repo.
- WebView2Utilities — tool for managing WebView2 debugging; the "david-risney / WebView2Utilities" repo.
Blogs: