Note
Access to this page requires authorization. You can try signing in or changing directories.
Access to this page requires authorization. You can try changing directories.
Use Microsoft Edge Developer Tools to debug web content displayed in WebView2 controls, in the same way that you can debug another webpage that's displayed in Microsoft Edge.
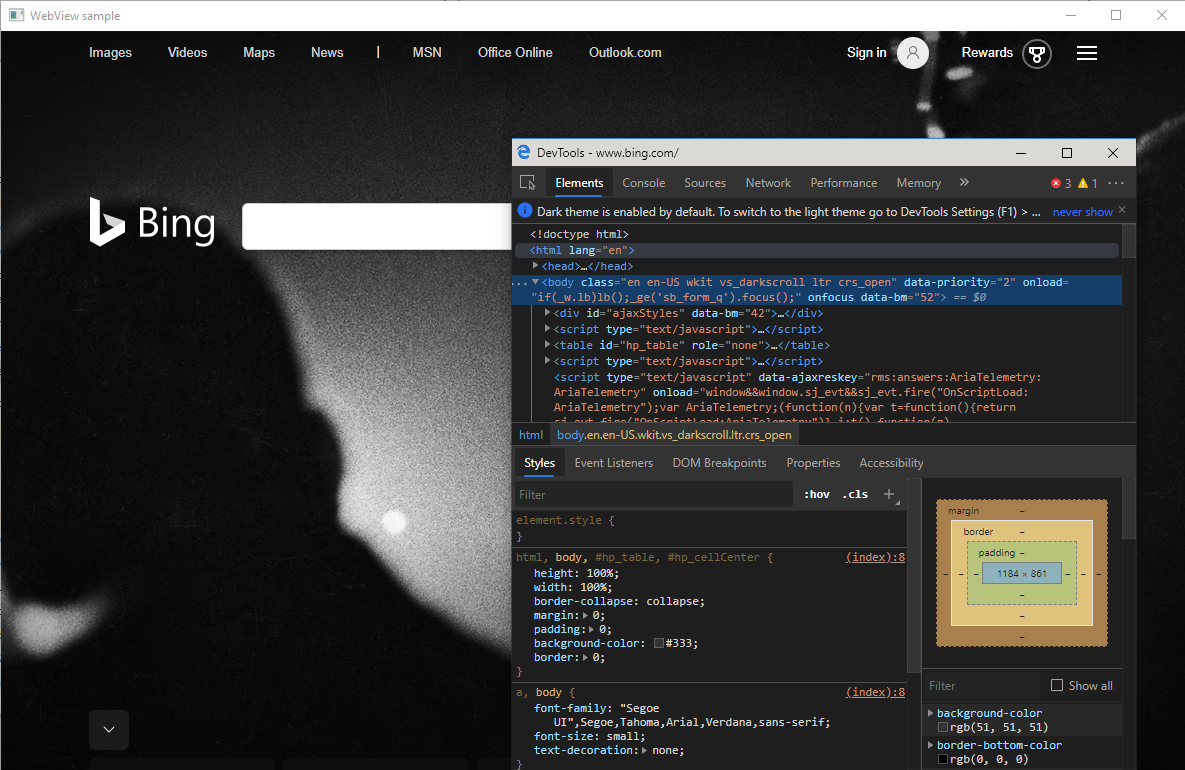
When you're using a WebView2 app, there are several ways to open DevTools:
- Press F12.
- Press Ctrl+Shift+I.
- Right-click the page and then select
Inspect.
An app can also use the OpenDevToolsWindow API to programmatically open a DevTools window. For example, you can use this approach if the above hotkeys and the context menu items have been removed.
If none of the above approaches are available, you can add --auto-open-devtools-for-tabs to the browser arguments via an environment variable or registry key. This approach will open a DevTools window when a WebView2 is created.
Source maps with the WebResourceRequested event or virtual host name mapping
Source maps are needed to debug the source code of compiled content, including:
- Transpiled JavaScript, such as TypeScript or minified JavaScript.
- Compiled CSS, such as SASS or SCSS.
WebView2 doesn't load source maps that are referenced by content which was loaded by using either approach:
The
WebResourceRequestedevent. See:- Loading local content by handling the
WebResourceRequestedevent in Using local content in WebView2 apps. - Source maps with the
WebResourceRequestedevent in Using local content in WebView2 apps.
- Loading local content by handling the
Virtual host name mapping. See:
- Loading local content by using virtual host name mapping in Using local content in WebView2 apps.
- Source maps with virtual host name mapping in Using local content in WebView2 apps.
See also
- Overview of DevTools.
- Get started with WebView2
- WebView2Samples repo - a comprehensive example of WebView2 capabilities.
- WebView2 API reference