Note
Access to this page requires authorization. You can try signing in or changing directories.
Access to this page requires authorization. You can try changing directories.
Use Microsoft Visual Studio Code to debug scripts that run in WebView2 controls. Visual Studio Code has a built-in debugger for browser debugging. See Browser debugging in VS Code.
Create a launch.json file
To debug your code, your project must have a launch.json file. A launch.json file is a debugger configuration file to configure and customize the Visual Studio Code debugger. One of the properties that's needed to configure the debugger is the request property. There are two request types: launch and attach.
The following code demonstrates launching the app from Visual Studio Code (rather than attaching the debugger to a running instance of the app). To do this, the app must have been built previously. If your project doesn't have a launch.json file, create a new launch.json file in the .vscode subfolder in your current project, and paste the following code into it:
"name": "Hello debug world",
"type": "msedge",
"port": 9222, // The port value is optional, and the default value is 9222.
"request": "launch",
"runtimeExecutable": "C:/path/to/your/webview2/app.exe",
"env": {
   // The following variable is needed when the "runtimeExecutable" property is set.
   // The port number below must match the value of the "port" property above.
   "WEBVIEW2_ADDITIONAL_BROWSER_ARGUMENTS": "--remote-debugging-port=9222"
   // Customize for your app location.
   "Path": "%path%;e:/path/to/your/app/location; "
},
"useWebView": true,
// The following two lines set up source path mapping, where "url" is the start page
// of your app, and "webRoot" is the top-level directory containing all your code files.
"url": "file:///${workspaceFolder}/path/to/your/toplevel/foo.html",
"webRoot": "${workspaceFolder}/path/to/your/assets"
Using a registry value
Instead of setting the WEBVIEW2_ADDITIONAL_BROWSER_ARGUMENTS environment variable, you can add a new registry value named <myApp.exe> with data --remote-debugging-port=9222 to the registry under registry key Computer\HKEY_CURRENT_USER\Software\Policies\Microsoft\Edge\WebView2\AdditionalBrowserArguments, so that the debugger can find the proper port. For more information, see WebView2 browser flags.
Command-line URL parameter passed in
Visual Studio Code source path mapping now requires an URL, so your app now receives a url command-line parameter when it starts. You can safely ignore the url parameter, if needed.
Debug your code
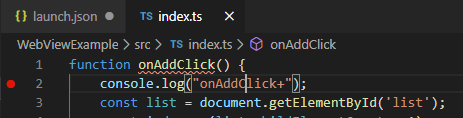
To set a breakpoint in your source code, click a line of code and then press F9:
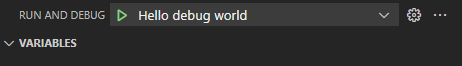
On the Run tab, select the launch configuration from the dropdown menu.
Click Start Debugging, which is the green triangle next to the launch configuration dropdown list:
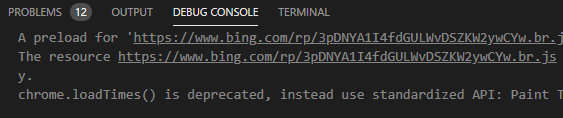
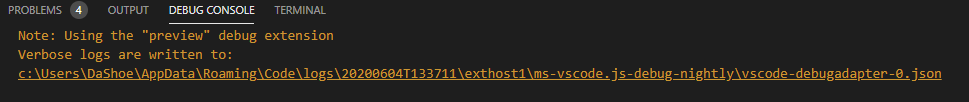
To view the debug output and errors, open Debug Console:
Targeted WebView2 debugging
In some WebView2 apps, you might use more than one WebView2 control. To pick which WebView2 control to debug in this situation, you can use targeted WebView2 debugging.
Open launch.json and complete the following actions to use targeted WebView2 debugging.
Confirm that the
useWebviewparameter is set totrue.Add the
urlFilterparameter. When the WebView2 control navigates to a URL, theurlFilterparameter value is used to compare strings that appear in the URL.
"useWebview": "true",
"urlFilter": "*index.ts",

// Options for "urlFilter":
// Match any url that ends with "index.ts":
"urlFilter": "*index.ts",
// Match any url that contains "index" anywhere in the URL:
"urlFilter": "*index*",
// Explicitly match a file named "index.ts":
"urlFilter": "file://C:/path/to/my/index.ts",
When debugging your app, you might need to step through the code from the beginning of the rendering process. If you are rendering webpages on sites and you don't have access to the source code, you can use the ?=value option, because webpages ignore unrecognized parameters.
Cannot debug two WebView2 controls at the same time
After the first match is found in the URL, the debugger stops. You cannot debug two WebView2 controls at the same time, because the CDP port is shared by all WebView2 controls, and uses a single port number.
Debug running processes
You might need to attach the debugger to running WebView2 processes. To do that, in launch.json, update the request parameter, changing its value to attach:
"name": "Hello debugging world",
"type": "msedge",
"port": 9222,
"request": "attach",
"runtimeExecutable": "C:/path/to/your/webview2/myApp.exe",
"env": {
   "Path": "%path%;e:/path/to/your/build/location; "
}
Your WebView2 control must open the Chrome Developer Protocol (CDP) port to allow debugging of the WebView2 control. Your code must be built to ensure that only one WebView2 control has a CDP port open, before starting the debugger.
You also need to add a new REGKEY <myApp.exe> = --remote-debugging-port=9222 under Computer\HKEY_CURRENT_USER\Software\Policies\Microsoft\Edge\WebView2\AdditionalBrowserArguments, so that the debugger can find the proper port. To add this registry key:
Press the Windows logo key and then search for registry editor. Open the Registry Editor app, and then click Yes to allow editing.
In the folder tree on the left, try to expand
HKEY_CURRENT_USER\Software\Policies\Microsoft\Edge\WebView2\AdditionalBrowserArguments.If the
\Edge\WebView2\AdditionalBrowserArgumentspart of that path doesn't exist, create those three nested subfolders, as follows:To create the
\Edgesubfolder: In the folder tree, right-click theHKEY_CURRENT_USER\Software\Policies\Microsoftfolder, hover over New, and then select Key. A folder is added as a child of theMicrosoftfolder, initially namedNew Key #1. Right-click theNew Key #1folder, and then select Rename. EnterEdgefor the name of the new key.Create the
\WebView2subfolder, as in the previous step.Create the
\AdditionalBrowserArgumentssubfolder, as in the previous step.The tree is now expanded to
HKEY_CURRENT_USER\Software\Policies\Microsoft\Edge\WebView2\AdditionalBrowserArguments.
Right-click the
AdditionalBrowserArgumentsfolder, hover over New, and then select String Value. In the Name column, right-clickNew Value #1, select Rename, and then enter the file name of your app executable, such asmyApp.exe.In the Name column, right-click your executable file name, such as
myApp.exe, and then select Modify. The Edit String dialog opens.In the Value data text box, enter
--remote-debugging-port=9222: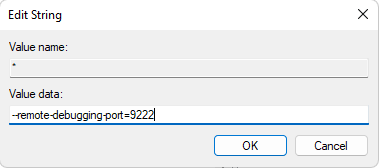
Click the OK button, and then verify that the registry key matches the following (with the file name of your
.exefile in the Name column):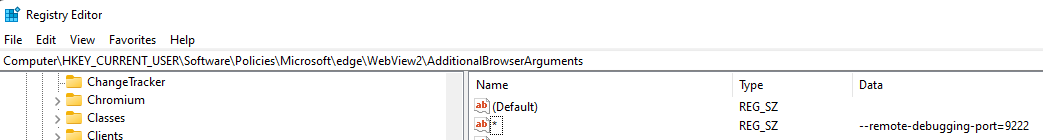
Using an environment variable
Instead of adding the above registry key, you can set the WEBVIEW2_ADDITIONAL_BROWSER_ARGUMENTS environment variable to --remote-debugging-port=9222. Make sure that your application is started after the environment variable is set, and make sure that your application inherits the environment variable. For more information, see WebView2 browser flags.
Debug tracing options
To enable debug tracing, add the trace parameter to launch.json , as follows:
- Add the
traceparameter:
"name": "Hello debugging world",
"type": "msedge",
"port": 9222,
"request": "attach",
"runtimeExecutable": "C:/path/to/your/webview2/app.exe",
"env": {
"Path": "%path%;e:/path/to/your/build/location; "
},
"useWebView": true
,"trace": true  // Turn on debug tracing, and save the output to a log file.
Saving debug output to a log file:
,"trace": "verbose" // Turn on verbose tracing in the Debug Output pane.
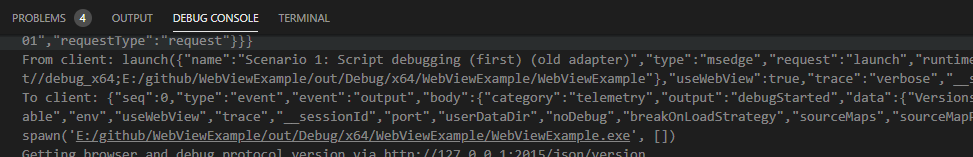
Visual Studio Code output in the DEBUG CONSOLE pane, with verbose tracing turned on:
Debug Office Add-ins
If you're debugging Office Add-ins, open the add-in source code in a separate instance of Visual Studio Code. Open launch.json in your WebView2 app. Add the following code into launch.json, to attach the debugger to the Office add-in:
,"debugServer": 4711
Debug WebView2 WinUI 2 (UWP) apps
Install a WebView2 Runtime version past
106.0.1370.34.Open the Registry Editor by pressing the Windows logo key and then searching for registry editor. Open the Registry Editor application and select Yes to allow editing.
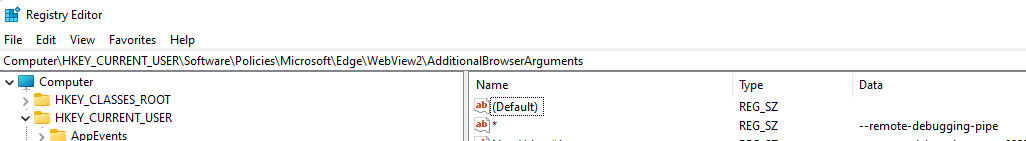
Set the registry key
HKEY_CURRENT_USER\Software\Policies\Microsoft\Edge\WebView2\AdditionalBrowserArgumentsequal to--remote-debugging-pipe. To do this, follow the steps outlined in the Debug running processes section above.Verify that the registry key is set in the editor and matches the following:
Add a new configuration to your
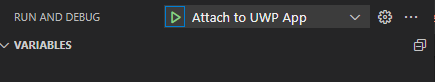
launch.jsonfile. Openlaunch.jsonand add the following code:"name": "Attach to UWP App", "useWebView":{ "pipeName":"JSDebugPipe" } "request": "attach", "type": "msedge", "webRoot":"${workspaceFolder}"Launch your app.
Click the Start Debugging button to attach to the process and begin debugging.
Source maps with the WebResourceRequested event or virtual host name mapping
Source maps are needed to debug the source code of compiled content, including:
- Transpiled JavaScript, such as TypeScript or minified JavaScript.
- Compiled CSS, such as SASS or SCSS.
WebView2 doesn't load source maps that are referenced by content which was loaded by using either approach:
The
WebResourceRequestedevent. See:- Loading local content by handling the
WebResourceRequestedevent in Using local content in WebView2 apps. - Source maps with the
WebResourceRequestedevent in Using local content in WebView2 apps.
- Loading local content by handling the
Virtual host name mapping. See:
- Loading local content by using virtual host name mapping in Using local content in WebView2 apps.
- Source maps with virtual host name mapping in Using local content in WebView2 apps.
Troubleshoot the debugger
You might encounter these scenarios when using the debugger.
Doesn't stop at breakpoint
If the debugger doesn't stop at the breakpoint, and you have debug output:
To solve the issue, confirm that the file with the breakpoint is the same file that's used by the WebView2 control. The debugger doesn't perform source path mapping.
Can't attach to running process
If you can't attach to a running process, and you get a timeout error:
To solve the issue, confirm that the WebView2 control opened the CDP port. Make sure your additionalBrowserArguments value in the registry is correct, or the options are correct. See additionalBrowserArguments for dotnet and additionalBrowserArguments for Win32.
See also
- Get started with WebView2
- WebView2Samples repo - a comprehensive example of WebView2 capabilities.
- WebView2 API reference