Note
Access to this page requires authorization. You can try signing in or changing directories.
Access to this page requires authorization. You can try changing directories.
To use Microsoft Edge DevTools to debug a WebView2 WinUI 2 (UWP) app, use remote debugging. Remote debugging is necessary for WebView2 WinUI 2 (UWP) apps because currently, the built-in DevTools can't be launched inside a store-signed WebView2 WinUI 2 (UWP) app.
WebView2 on HoloLens 2 and the WebView plugin for Unity are both in Preview and are subject to change before general availability.
WebView2 and the WebView2 plugin are only supported on HoloLens 2 devices running the Windows 11 update. For more information, see Update HoloLens 2.
Attach DevTools remotely to a HoloLens 2 WebView2 WinUI 2 (UWP) app
Attach Microsoft Edge DevTools remotely to a HoloLens 2 WebView2 WinUI 2 (UWP) app as follows:
In Microsoft Edge, go to
edge://inspect. The Inspect with Edge Developer Tools page opens: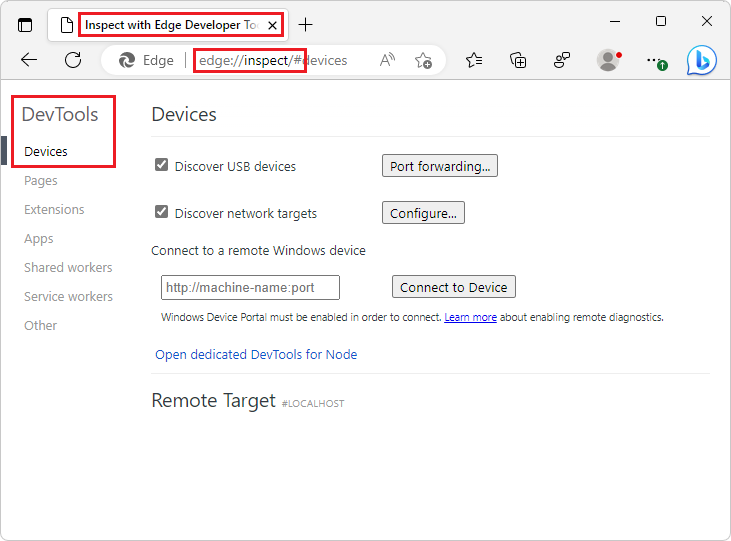
Enable Device Portal: Open Windows Settings, select Update & Security > For developers, and then turn on the Device Portal toggle:
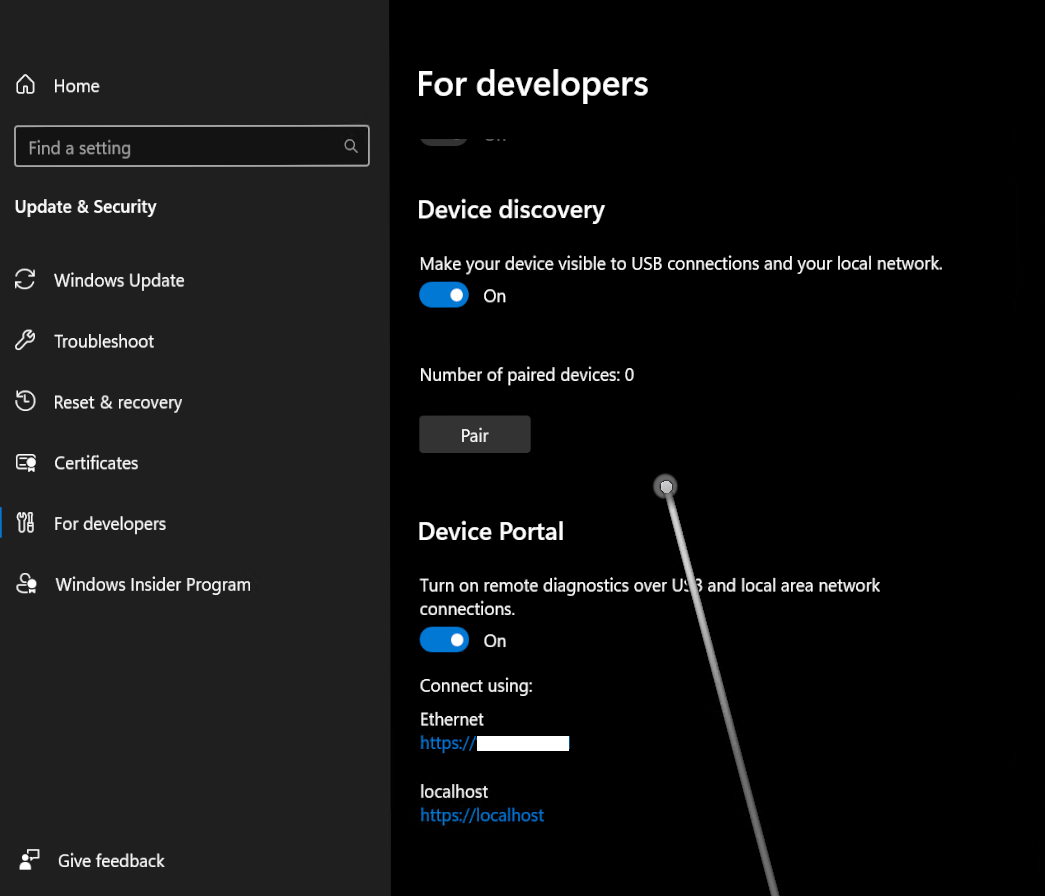
In Connect using > Ethernet, note the URL that will be used for the remote debugging connection.
Install Remote Tools for Microsoft Edge from the Microsoft Store on your HoloLens 2 device.
In Microsoft Edge, go to the Device Portal URL that you previously noted. Verify that the Confirm security settings page is loaded (in the Windows Device Portal tab):
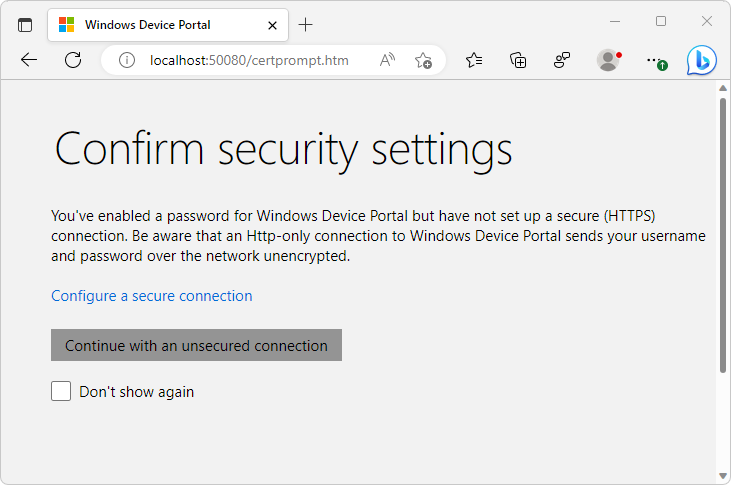
If you are only debugging apps that are running locally, you can select the Continue with an unsecured connection button.
Or, if you aren't running the app locally, or if you need to connect over HTTPS, select the Configure a secure connection link, and then follow the steps in the page that you're redirected to.
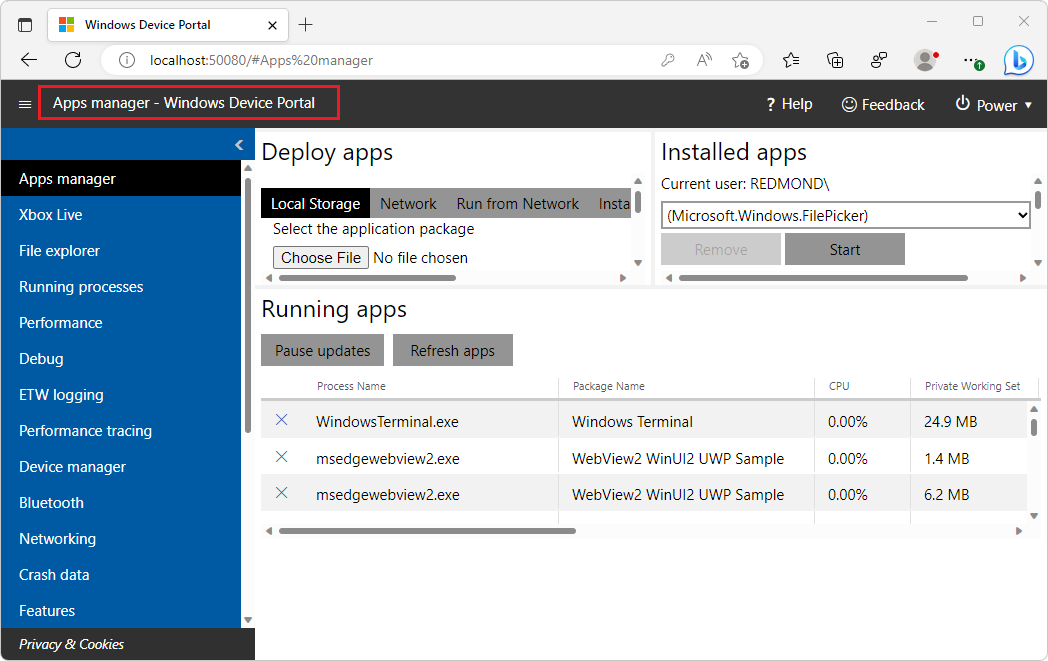
Verify that you're redirected to the Apps manager: Windows Device Portal page:
Go to
http://<Device Portal URL>/msedgeand verify Remote Tools for Microsoft Edge are functioning. The page loads an empty list:[], unless there's an application running that is debuggable by remote tools.Configure your WebView2 WinUI 2 (UWP) app for remote debugging:
To enable remote debugging, an environment variable must be set in your project. This variable must be set before creating the
CoreWebView2instance, and before either setting theWebView2.Sourceproperty or calling theWebView2.EnsureCoreWebView2Asyncmethod.Set the following variable:
"WEBVIEW2_ADDITIONAL_BROWSER_ARGUMENTS", "--enable-features=msEdgeDevToolsWdpRemoteDebugging"For example, if you're using the WebView2 Sample UWP app, you can set the environment variable by adding the following line in the
Browser.xaml.csfile:Environment.SetEnvironmentVariable("WEBVIEW2_ADDITIONAL_BROWSER_ARGUMENTS", "--enable-features=msEdgeDevToolsWdpRemoteDebugging");The line is numbered 33 in this screenshot, in the
Browser()constructor, below an#endifthat wraps an existingSetEnvironmentVariablestatement: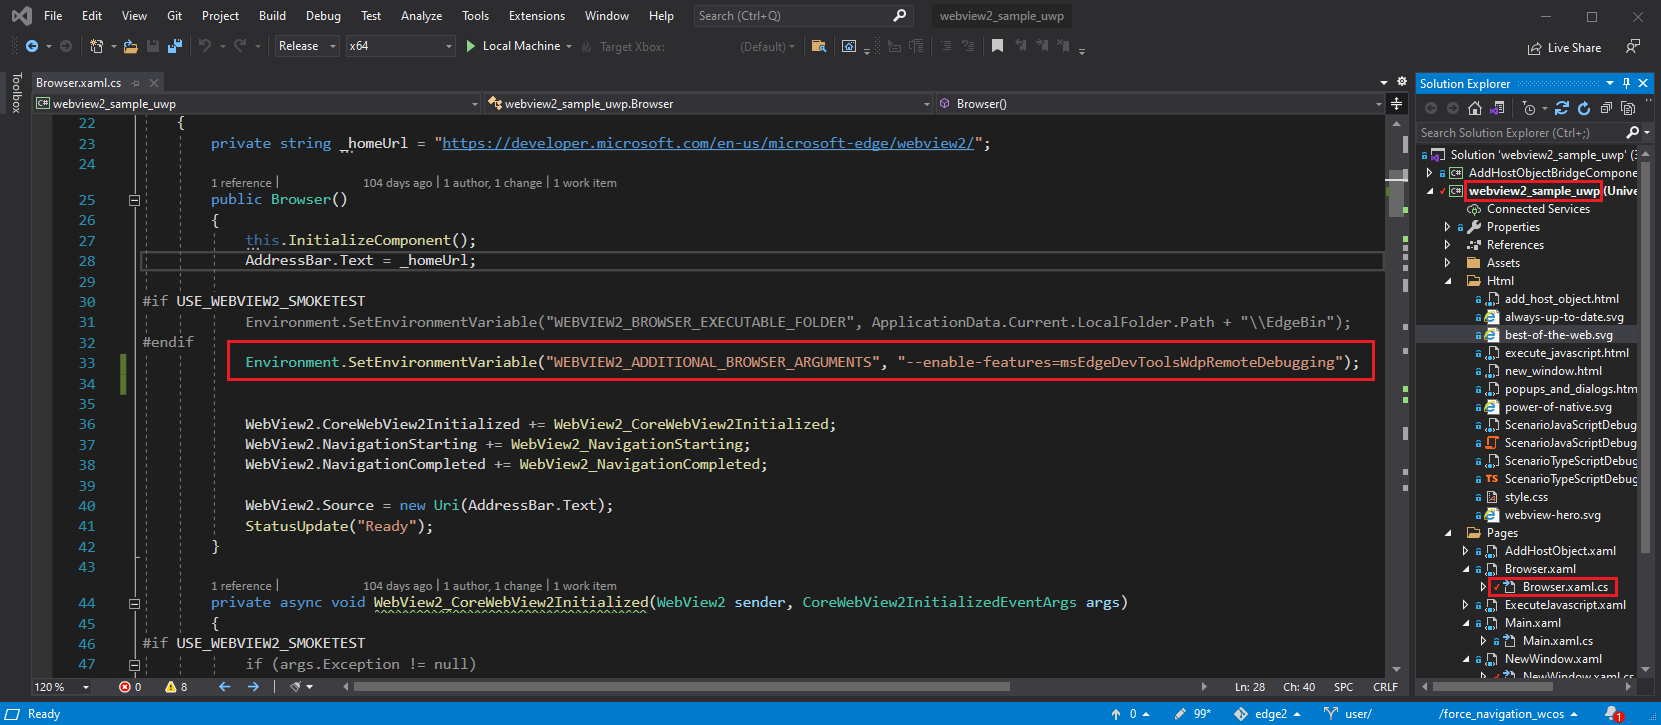
Launch your app on your HoloLens 2 device.
Go to
http://<Device Portal URL>/msedge, such ashttp://localhost:50080/msedge, and make sure your WebView2 instance appears in the list: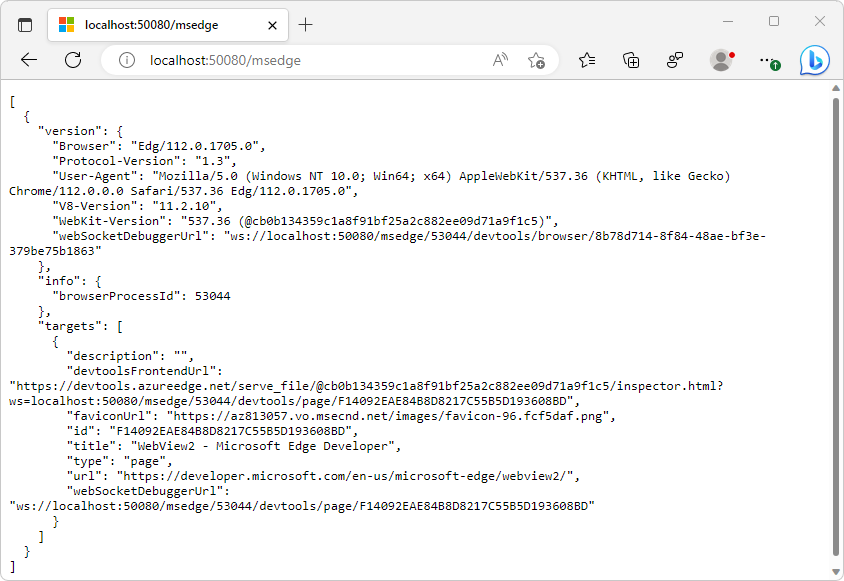
Go to
edge://inspect. In the Connect to a remote Windows device text box, enterhttp://<Device Portal URL>, such ashttp://localhost:50080, and then click Connect to Device.Verify that you can successfully connect, so that your debuggable WebView2 control, named Edge, is listed under your machine name:
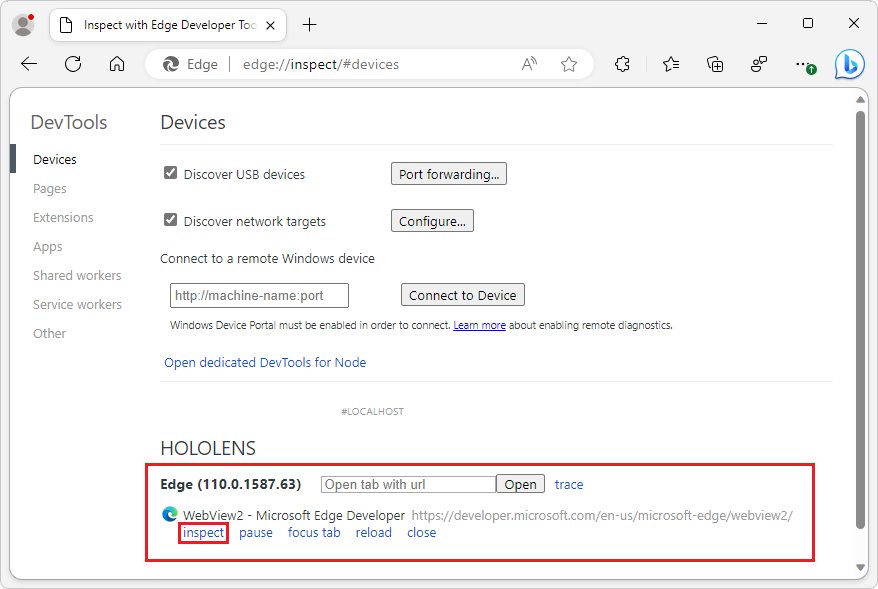
At the bottom of the Edge WebView2 control entry, click the inspect link. Microsoft Edge DevTools opens for the WebView2 control:
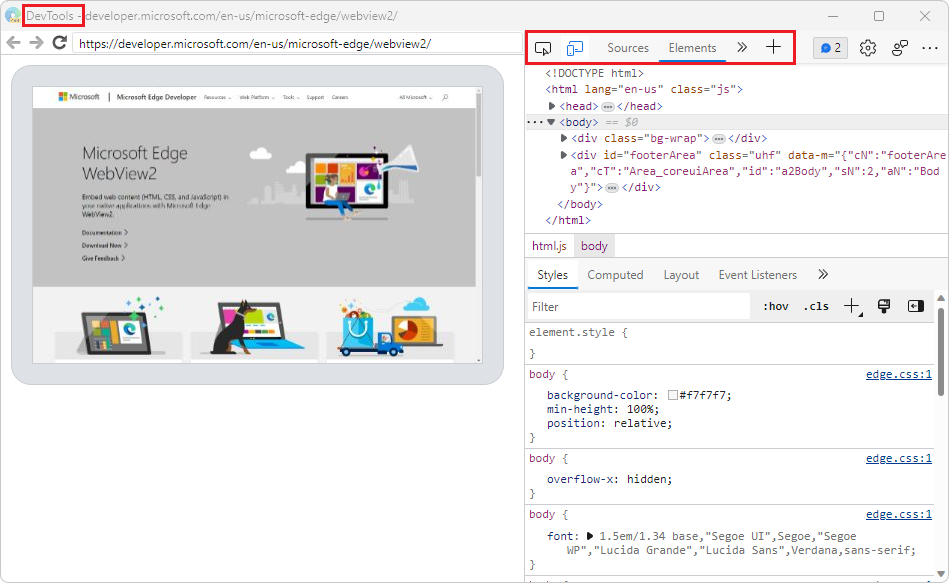
Now you can use Microsoft Edge DevTools to inspect and debug the WebView2 control in your HoloLens 2 WebView2 WinUI 2 (UWP) app.