Note
Access to this page requires authorization. You can try signing in or changing directories.
Access to this page requires authorization. You can try changing directories.
After an app is distributed in an organization or in Microsoft Teams Store, it's important to track how users are interacting with the app. With growing app users, the number of app installs might not be a relevant metric.
It's important to plan for the kind of data, metrics, and events you want to monitor as you develop your Teams app. Your product’s North Star metric would guide you in establishing the right set of metrics, core user action, and key events relevant for your business.
To have long-term sustainability in the ecosystem an app must have good growth of new users. The second attribute is engagement and retention. Users must come back to the app and continue to find value in it and use it. Lastly, the third quality is revenue. The app must provide sufficient value to users, such that there is willingness to pay. Apps must possess all three of these qualities to be successful long-term on the platform. If any of these three qualities are missing in an app, it has a low probability of success on the platform.
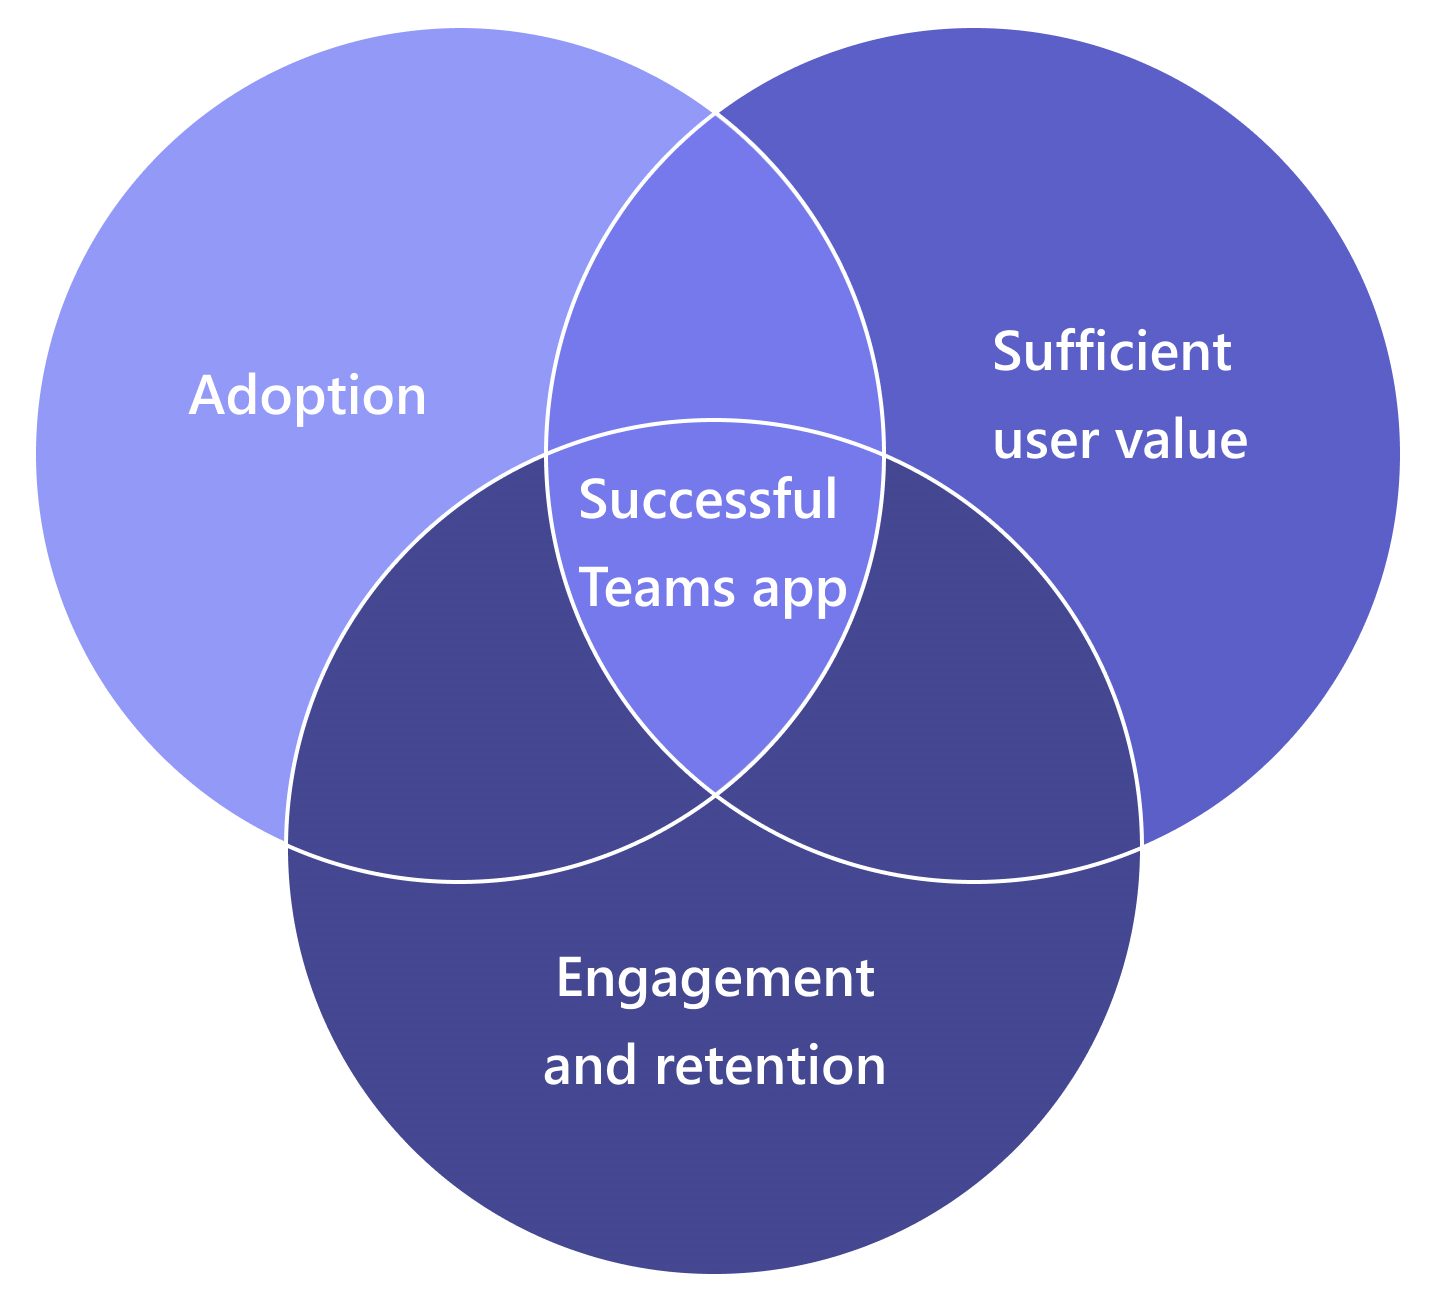
Your instrumentation strategy should ensure measuring of your product across these three qualities.
Monitor events for your app
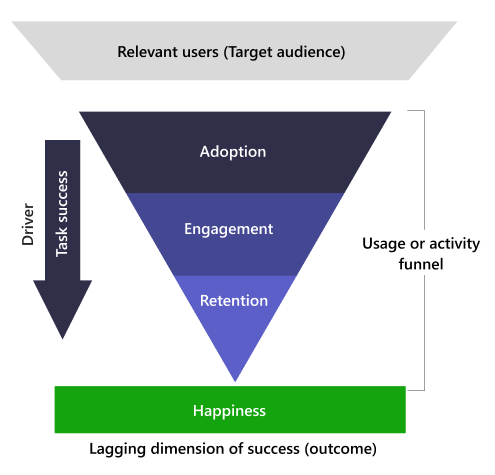
For the purposes of this article, let’s use the HEART framework to indicate a representative set of metrics and events you should consider monitoring for your solution. Note that the following list isn't exhaustive, and you're encouraged to add additional instrumentation relevant to your business and product.
Adoption
Goal: Acquire new users who can start exploring the app thereby maintaining a healthy top of the funnel. Discovery and adoption of new apps happen in one of the following ways:
- User searches and installs the app on their own.
- User stumbles upon the app when it’s shared in a chat, meeting, or channel by another user, (tab or Adaptive Card).
- Admin installs the app for users and the app sends a welcome message.
Instrumentation designed to improve adoption should aim at improving discoverability of the app and its features as well. The likelihood of discovering an app among new users increases when existing users start using the app in collaborative scope. For example, adding a channel or meeting tab, adding a bot to channel, or sharing messaging extension card in a group chat.
Tip
- Measure usage of app in collaborative scope and the time taken to discover your app features in collaborative or meeting scope. If the usage is low or time taken is high, socialize said features better in app or via marketing efforts.
- While measuring overall adoption is good to start, measure adoption at a platform capability and feature level.
| Measure | Insights |
|---|---|
| • Users installing the app in R1, R7, R14, R28 days. • # Sign-ins (if app has sign-in). |
• App level adoption broken down at tenant, region, and segment. • Segment users based on Microsoft Entra profile. • Segment by tenant and org name. |
| • Average time taken to first use (click on tab, bot, Adaptive Card, and meeting). | • Report at a feature or platform capability level to measure feature level adoption. |
| • Extensibility point of first discovery. • Scope of first discovery. |
• Use the data to measure which extensibility point and scope are most used to discover your app by your end users. |
| • % of link unfurls leading to app installation. | • Users interested in installing app, post-discovery. |
| • Average time taken to add app in collaborative scope - in channel, group chat, and meeting. | • Usage penetration within the app. |
| • % of users adding app in collaborative scope. | • Helps in determining the potential for virality, that is, organic discovery and use by new users. |
| • % of users configuring the app after adding it in channel or group chat. | • If app isn't configured on the day of install, there's 5% chance of user configuring it in the following week. |
Engagement and task success
Goal: Grow number of engaged quality users who complete core actions within the app.
Core action is defined as that user action, which is central to the business and directly contributes towards the North Star. For example, if you're an IT Ticketing solution provider, your core user action could be ‘Creating a ticket’ with the steps of searching an issue, escalations being key business events in the user journey funnel that propel the users towards the core action.
Engagement intends to measure the intensity and depth of interaction between the user and your app. Intensity of engagement measures how much a user is using the app (for example, the number of core actions done in the app). Depth of interaction measures the number of various platform capabilities, scopes, and app features with which a user has interacted.
Tip
- It's important to measure engagement and usage not just at the overall app level but also at individual app capability and feature level. Decide on core actions and key business events that define engaged users for your business. Just signing in or viewing the app may not be quality engagement.
- Core action is specific to your business, and you should have one core action correlating to your product’s North Star. Don't have more than 2-3 core actions.
- Key business events are auxiliary actions that users may take in their journey towards performing the core action. Key business events can help prepare a funnel view on how many users are going through the ideal user journey and determine points where drop offs are high.
| Measure | Comments |
|---|---|
| • # App users (R7, R14, R28). – DAU and MAU. • # App users trendline. |
• App and feature level engagement • Segment users based on Microsoft Entra profile. • Report by client – desktop, web, and mobile. • Segment by tenant and org name. • Segment by product feature (active users at feature level). |
| • % of users using key features in Teams app vs. using the same feature in a web or native app. | • Indicates discoverability, ease of use, and value of using the feature within Teams app. • Report at app feature level. |
| • #, % users using the app across different scopes (R28). | • Engagement penetration. • Report by scope. • Ability to drill down by capability. |
| • #, % users using the app in different platform capabilities (R28). • #, % Interacting with tab. • #, % Interacting with Messaging extension. • #, % Interacting with bot. • #, % Interacting with side panel in a meeting. • #, % Interacting with Stageview. |
• Engagement and value prop of app capabilities. • If usage of any of platform capabilities is low, consider drilling into details on ease of use and value add. |
| Task success | |
| • % of users completing core action. | • Ease of performing core task. • Report at a week level. |
| • User journey in a Teams app – Funnel view with user drop offs. | • Friction points in user journey. • Drill down at a tenant level. |
• Lostness Score for core action: 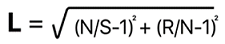
where, L = Lostness N = The number of different and unique steps performed while performing core action. S = The total number of steps performed while performing core action including repeat steps. R = The minimum number of steps required to complete core action. |
• Ease of use with regional drill provides insights on need for locale. • Drill down at region and tenant level. • If lostness is above 0.4 then app should improve the user experience to make completing core action easier for users. |
| • Mean time taken to perform core action. | • Ease of use. • Report alongside meantime taken performing core action outside the Teams app. |
| • Average number of times core action was performed in a month. • Average number of times key business events were performed in a month. |
• Level and intensity of engagement. • View month over month trend. • Drill down by tenant. |
Retention
Goal: Improve product stickiness by way of accruing benefits the more a user engages with the app.
User retention measures how frequent users come back to use the product. It essentially measures frequency of engagement. Users repeatedly use your product if they get more benefits. The more they use a product, the cost of switching apps is high. For example, when a user starts adding task or action items they track as part of your app, it may help in better coordination across projects and gradually it becomes costlier to abandon your task management system.
Tip
- Users using multiple Teams platform capabilities are 20 to 35pp better retained than single capability users.
- Converting new users to engaged platform users in their first week improves retention.
- Users who perform creation events in your app have higher retention compared to users who passively consume information via notifications. Creation events depend on your business. For example, creating a ticket, creating a new post, a project board, and so on.
- Apps used multiple times (>5 times) in a month have a better retention month over month. Recurring use cases with more frequency of usage improve retention.
| Measure | Insight |
|---|---|
| • New user retention cohort analysis (week over week, month over month). | • Retention breakdown by client – Teams desktop, web, and mobile app, non-Teams web app. • Drill down to a tenant level. |
| • User churn in 14 days, 28 days, 56 days, 72 days. | • User churn. • Drill down to a tenant level. • Platform capability and feature drill-down. • Churn breakdown by client: Teams desktop, web, and mobile app, non-Teams web app. |
| • #, % users using app in more than one scope. | • Depth of engagement. Goal would be to encourage use of app across different scopes. |
| • #, % users using more than 1 capability of the app. | • Depth of engagement. • Goal would be to encourage users to use different platform capabilities supported by app. |
| • Mean time between [Core Action 1,2..] per user. | • Intensity of engagement. • Report at tenant level. • Goal would be to reduce this time to promote recurring usage. |
| • % of users performing creation events. • % of users performing consumption events. Track: - Read receipts for bot messages. - Notification clicks. |
• Intensity of engagement. App retention is higher when more users perform creation events compared to pure consumption. |
| • App capability or scope with high recurring usage. | • Highly retentive capabilities or features of the app. |
Happiness
Goal: Provide sufficient, differentiated value to end user improving their willingness to pay.
Happiness intends to measure your user’s attitude towards your product and can translate to their willingness to pay and to refer other users to your product. Happiness is mostly self-reported. There are leading indicators such as, collecting feedback, satisfaction rating. Lagging indicators include new subscriptions and users preferring to use Teams app over other modalities.
Tip
- Happiness should be measured in context at right time and contextualized to user. Sending a generic survey on a fixed date might not give accurate happiness measurement as users might not remember their experience.
- Integrate product driven feedback capture and rating mechanisms for users to easily submit feedback and rating in the flow after completing core action.
- Provide adequate product support, helpdesk for users to get their queries clarified, report bugs and provide feedback.
| Measure | Insight |
|---|---|
| • App Net Promoter Score (NPS) from app source. | • Net Promoter Score. • Microsoft Entra ID and tenant information. |
| • % of happy or satisfied users. | • Drill down at tenant level. • Report trend over time. |
| • % users using Teams app vs. web, or mobile app. | • Report month over month. |
| • User feedback on experience after completing core action. | • Introduce product led way for collecting feedback after completing core action (for example, in-app message to submit feedback). |
Next step
Collaborate with us on GitHub
The source for this content can be found on GitHub, where you can also create and review issues and pull requests. For more information, see our contributor guide.
Platform Docs