Note
Access to this page requires authorization. You can try signing in or changing directories.
Access to this page requires authorization. You can try changing directories.
Teams client health is an all-new page with a set of data, insights, and tools to help administrators troubleshoot and resolve issues. When a Teams application experiences an issue, end-users typically reach out to their admins. As an admin, you may have many requests from end-users. These requests can leave you in a reactive position with limited information to diagnose and resolve problems effectively.
You may need to proactively monitor for issues. You may also need to perform remediation actions to manage and fix issues before they impact your end user productivity or cause further escalations.
Access the Teams client health dashboard
To access the Teams client health dashboard, follow these steps:
- Go to the Teams admin center.
- Select Teams client health from the navigation pane.
The Teams client health page displays an overview of Teams client health along with more information when you go into the details.
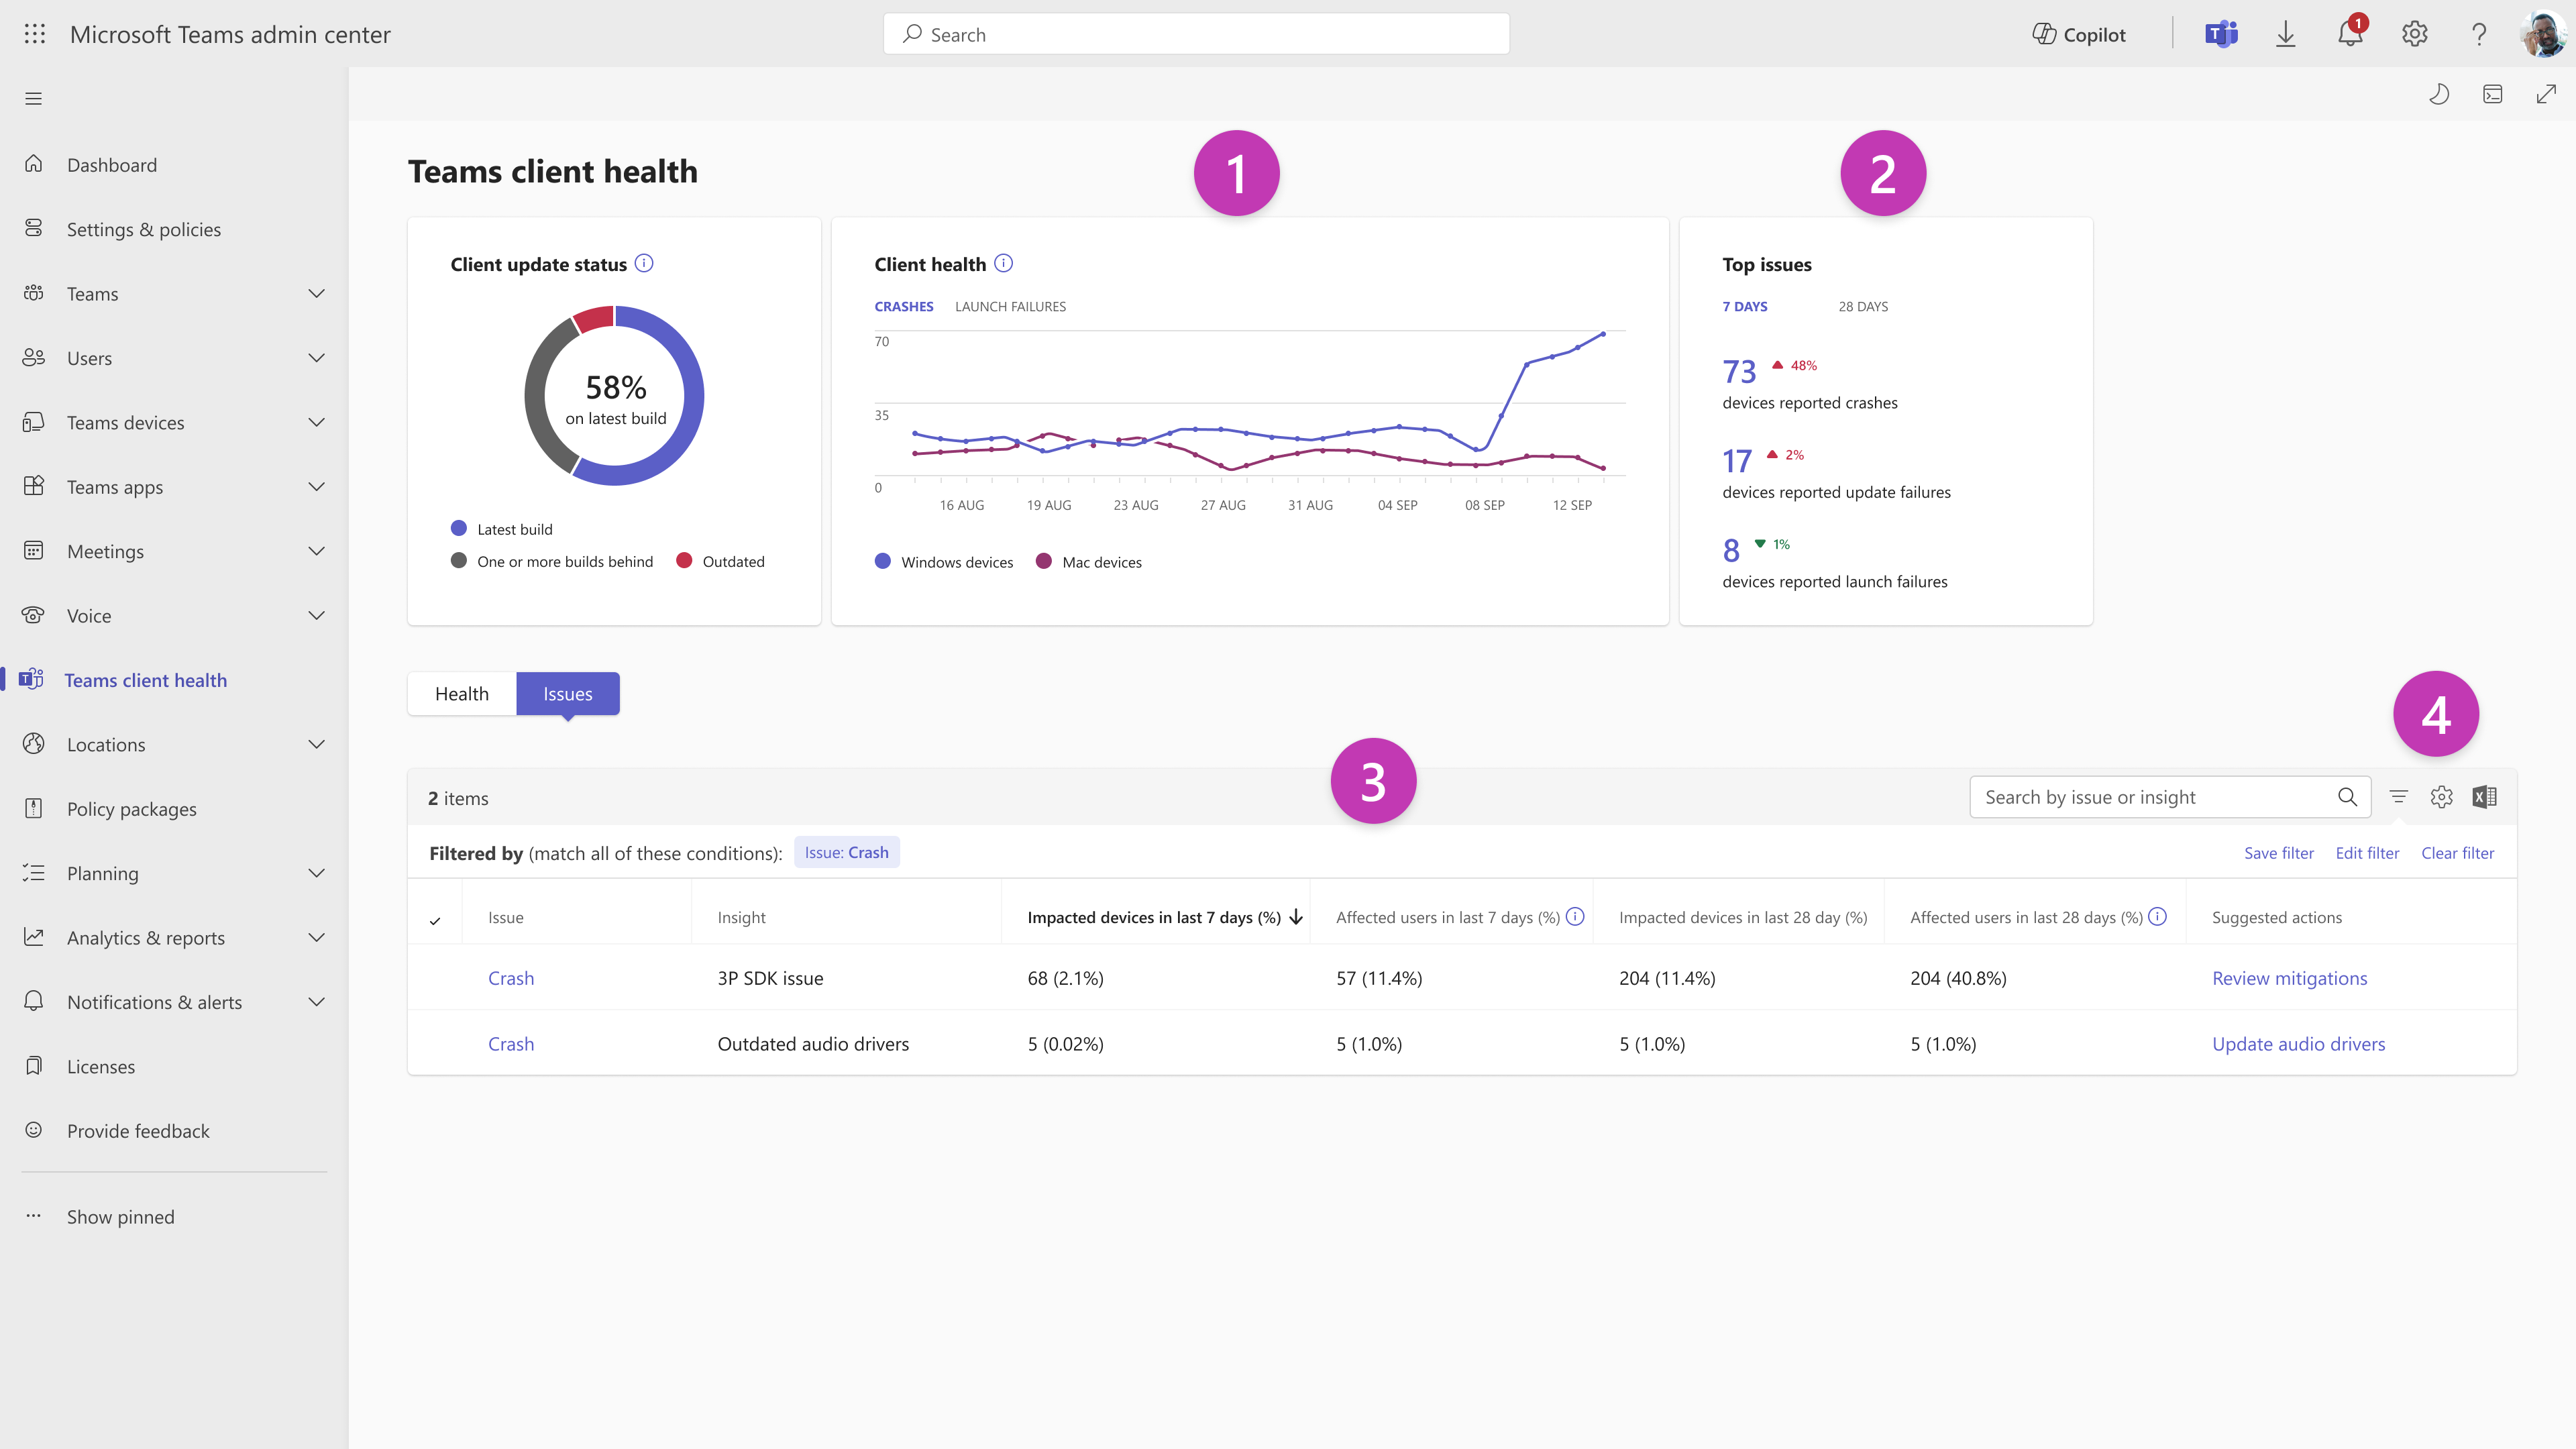
The Client health widget displays key health metrics like device crashes and launch failure trends for the last 28 days for all devices in your tenant.
Note
This widget only surfaces health markers that are end-user impacting and actionable by administrators.
Here are more details on each metric:
| Callout number | Details |
|---|---|
| Callout 1 | This widget shows Client health trends across the health metric: - Crashes: The number of devices experiencing Teams app crashes per day within the last 28 days. Supported for Windows (non-VDI) and Mac Applications. - Launch failures: The number of devices experiencing Teams app launch failures per day within the last 28 days. Supported for Windows (non-VDI) and Mac applications. |
| Callout 2 | This widget shows the top issues experienced by users in the organization: - Device reported crashes: The number of devices that experienced crashes in the last seven days. The number of devices that experienced crashes in last 28 days. - Device reported launch failures: The number of devices that experienced launch failures in the last seven days. The number of devices that experienced launch failures in the last 28 days. - Device reported update failures: The number of devices that experienced update failures in last seven days. The number of devices that experienced update failures in last 28 days. |
| Callout 3 | This table provides the following data: - Issue: Problems impacting devices and users in the tenant. - Insights: Insights on potential reasons behind these problems. - Impacted Devices in the last seven days (%): The number of devices that experienced the issue in the last seven days and the percentage of the device base impacted in the organization. - Affected users in the last seven days (%): The number of users who experienced the issue in the last seven days and the percentage of the user base impacted in the organization. - Impacted Devices in the last 28 days (%): The number of devices that experienced the issue in the last 28 days and the percentage of the device base impacted in the organization. - Affected users in the last 28 days (%): The number of users who experienced the issue in the last 28 days and the percentage of the user base impacted in the organization. - Suggested Actions: Recommended mitigation guidance to troubleshoot and fix the issue. |
| Callout 4 | You can use these buttons to: - Export the table to a CSV file. - Filter by issue or insight. - Access settings for the columns in the table. |
| Callout number | Details |
|---|---|
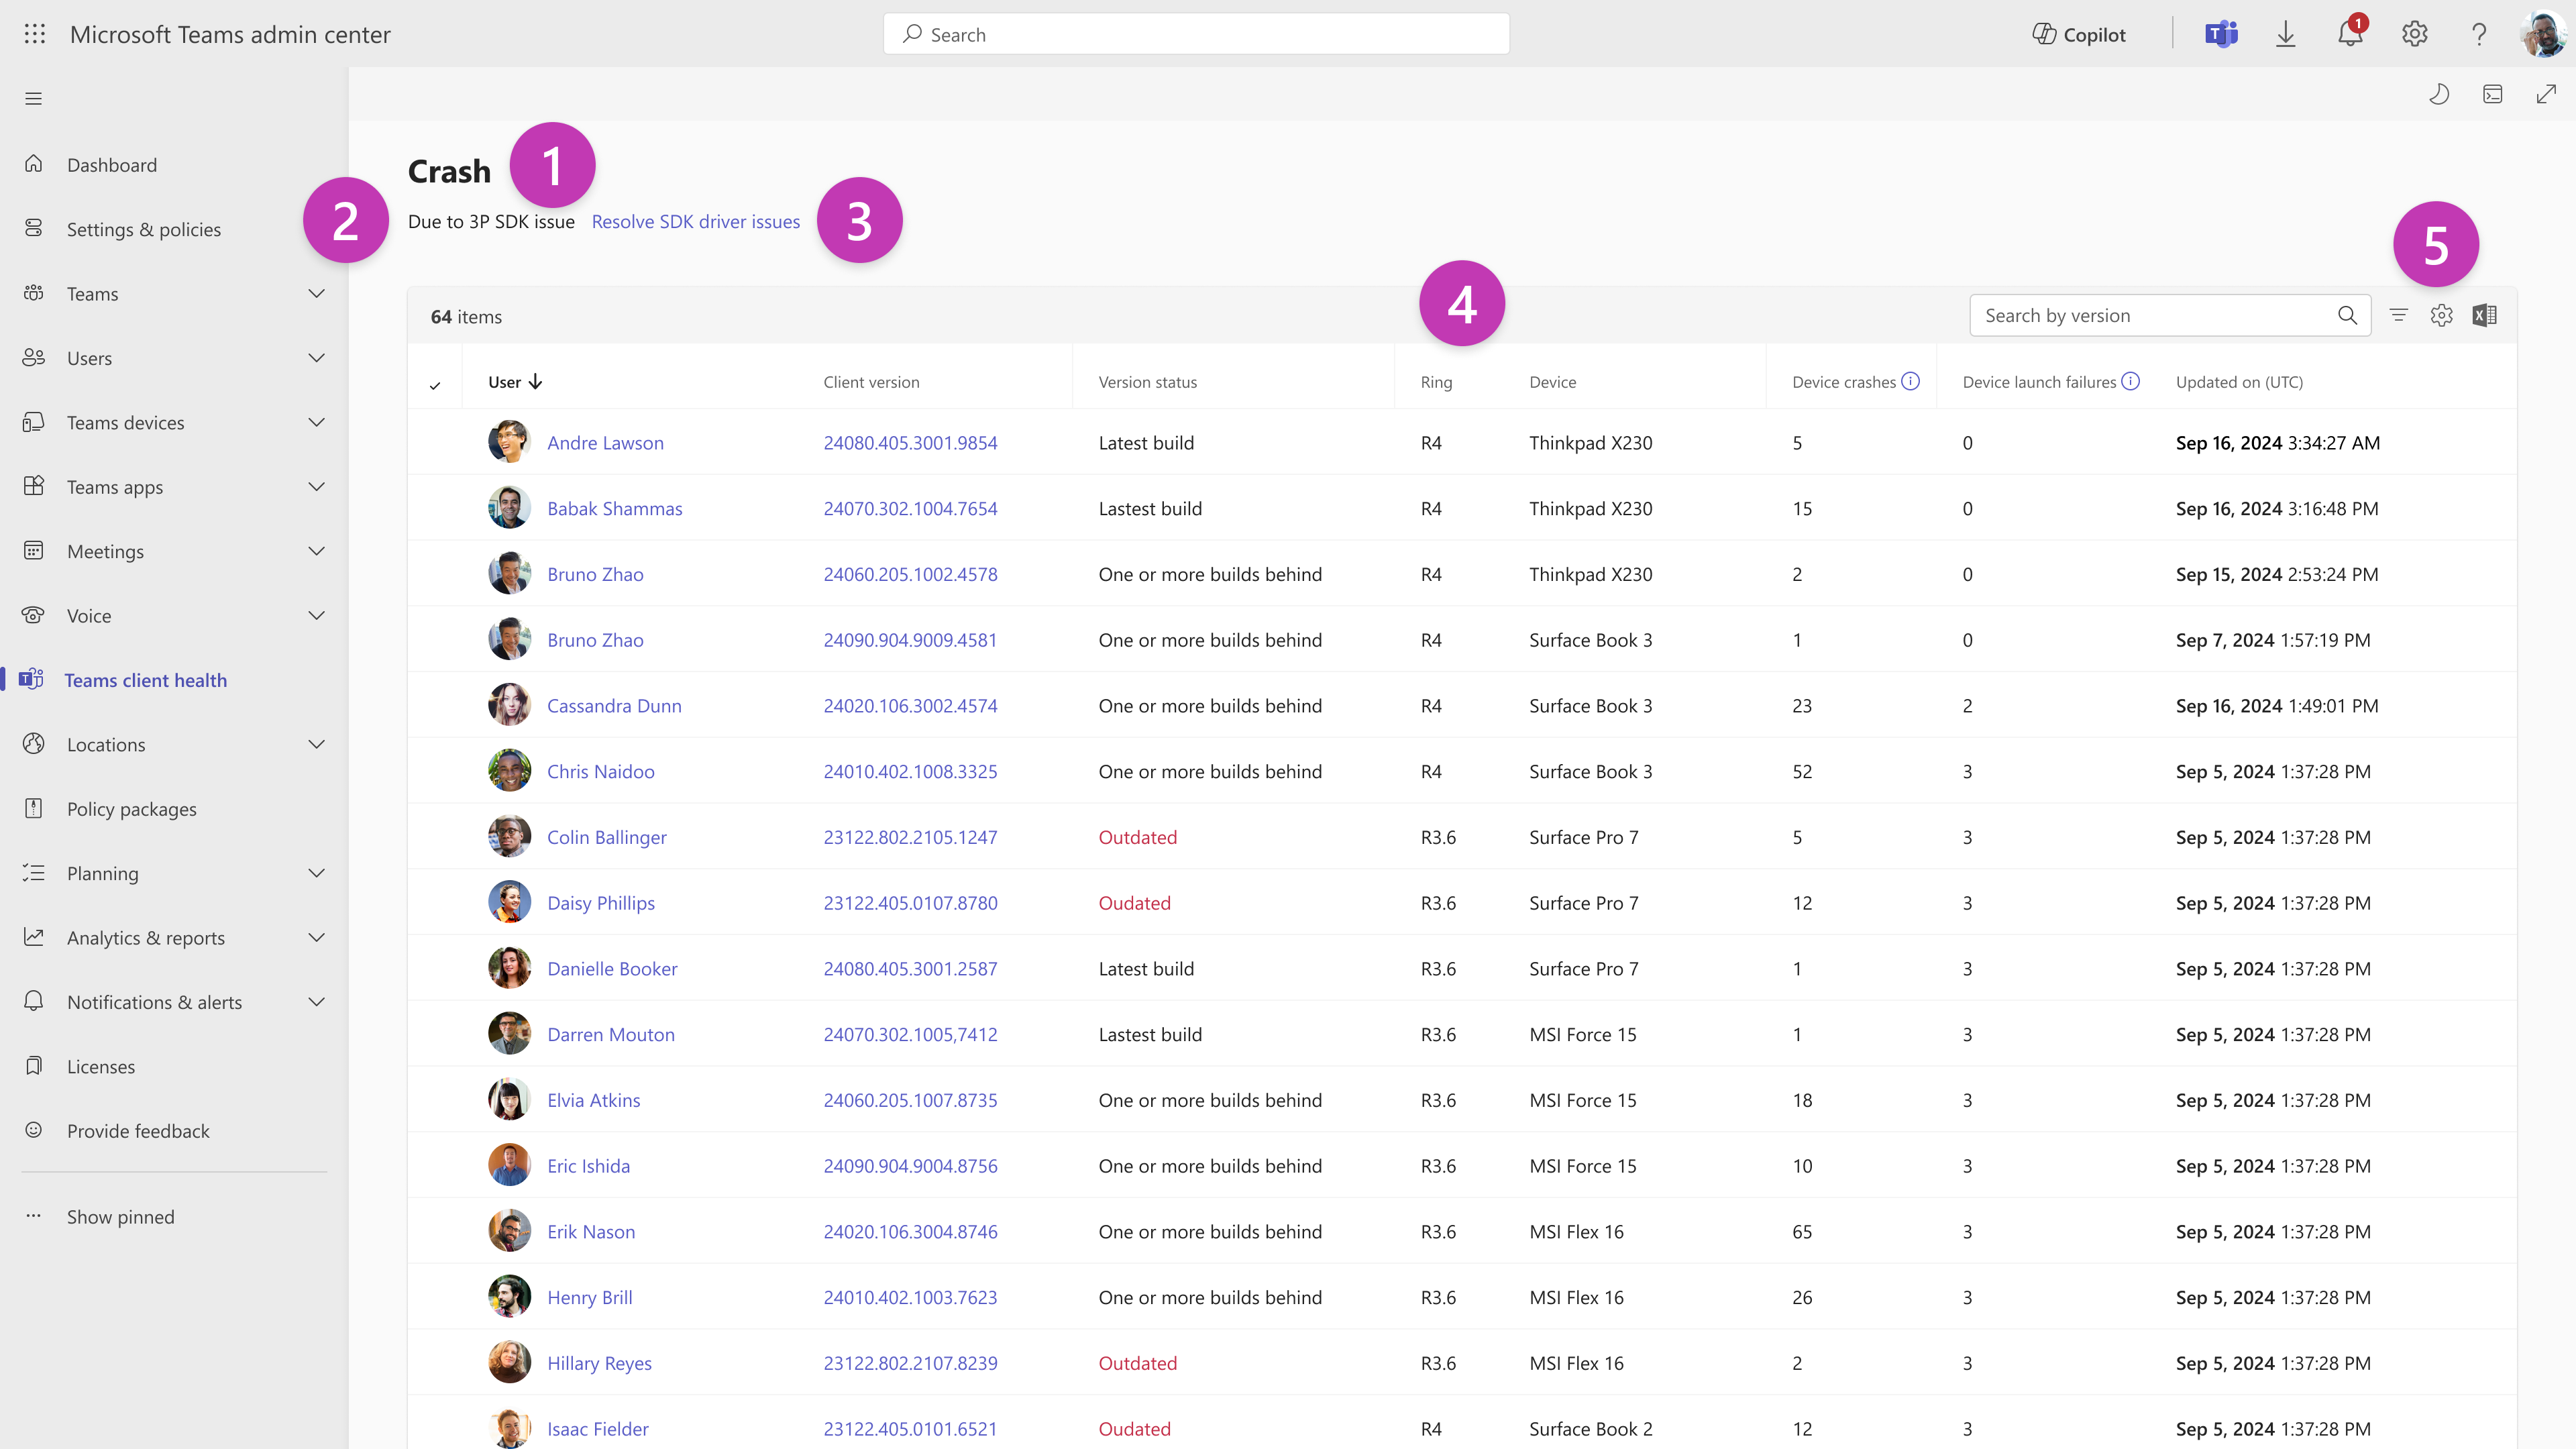
| Callout 1 | Issue type - The category of issue impacting users and devices. |
| Callout 2 | Insight - The insight or reason leading users and devices to experience the issue. |
| Callout 3 | Mitigation link - This link points to Microsoft recommended mitigation and guidance to resolving the issue. |
| Callout 4 | The table provides the following data - Client version - The Teams client version the user is currently on. - Version status - The client version status of the Teams client the user is running on. - Ring - The ring the user is a part of. - Device - Details about the device the user is currently using. - Device crashes - The number of devices that experienced crashes in last seven days. - Device launch failures - The number of devices that experienced launch failures in the last seven days. - Updated on (UTC) - The time stamp when this information was last refreshed. |
| Callout 5 | You can use these buttons to: - Export the table to a CSV file. - Filter and search by versions. - Manage settings for columns in the table. |