Note
Access to this page requires authorization. You can try signing in or changing directories.
Access to this page requires authorization. You can try changing directories.
In this tutorial, you create a Copilot skill for Excel that uses the APIs of the Office JavaScript Library (Office.js). The skill finds the first table on the first worksheet that has at least 12 columns and contains only numeric body data, then finds rows in that table whose data embodies an accelerating growth trend. For each matching row, it adds a chart of the rows data to the worksheet.
Note
- This tutorial assumes that you're familiar with Overview of Copilot skills for Excel (preview) and Build plugins for Copilot Cowork. Although the latter article is in the context of Cowork, the general packaging, manifest, icon, installation, and publishing guidance in that article also applies to Excel skills. This tutorial focuses on the Excel-specific pieces and uses the same plugin package model described in that article.
- Custom skills for Excel are in preview. Don't use them in a production Copilot extension.
What you'll build
You'll build a Microsoft 365 app package with one skill.
my-copilot-plugin-skills/
|-- manifest.json
|-- color.png
|-- outline.png
|-- skills/
    |-- accelerating-growth-trend-finder/
        |-- SKILL.md
        |-- resources/
        |   |-- workbook-data-guardrails.md
        |   |-- excel-vs-agent-execution.md
        |-- scripts/
            |-- find-accelerating-growth-trend-rows.js
The Office.js script implements the workbook analysis and editing. The SKILL.md file tells Copilot when to use the script and how to explain the result to the user.
Accelerating growth trend definition
For this skill, a row embodies an accelerating growth trend when both of the following are true.
- Each cell value, beginning with the second column, is higher than the value immediately to its left.
- Each increase, beginning with the increase from the second cell to the third cell, is larger than the preceding increase.
For example, the following row qualifies.
2, 4, 8, 15, 27, 46, 78, 130, 215, 351, 570, 921
The values are strictly increasing, and the size of the increases also strictly grow:
+2, +4, +7, +12, +19, +32, +52, +85, +136, +219, +351
Prerequisites
Before you start, make sure you have the Microsoft 365 Agents Toolkit CLI as described in "Step 7: Test" of Build plugins for Copilot Cowork.
Task 1: Create the plugin folders
Create the following folders.
my-copilot-plugin-skills/
| -- skills/
   | -- accelerating-growth-trend-finder/
       | -- resources/
       | -- scripts/
Task 2: Create SKILL.md
In the
skills/accelerating-growth-trend-finder/folder, create a file calledSKILL.md.Add the following YAML frontmatter (including the two
---lines) to the very top of the file. Note that themetadata.tagsvalue includesexcel, which helps identify the skill as Excel-oriented for purposes of skill discovery.--- name: accelerating-growth-trend-finder description: | Use this skill in Excel when the user asks to find rows in a workbook table that show an accelerating growth, increasingly larger increases, or numeric values that rise faster from left to right. metadata: category: Excel analysis version: 1.0.0 tags: excel, office-js, tables, trends, analysis ---Important
The value of the
nameproperty must exactly match the name of the of the child folder directly under theskillsfolder.Below the frontmatter, add the following Markdown to focus Copilot to the purpose and resources of the skill. You create the two resource files in a latter step.
# Accelerating growth trend finder

Find rows in the first qualifying Excel table whose numeric values increase from left to right with increasingly larger increases.

## Reference resources

Before running the script, consult:

- `resources/workbook-data-guardrails.md`
- `resources/excel-vs-agent-execution.md`

Use these resources to confirm that the current workbook is the right source of truth, that the skill is running inside Excel, and that the user is asking for workbook analysis rather than general advice.
Below the resources, add the following workflow section. You create the JavaScript file that calls Office.js in a later step.
## Workflow

1. Confirm that the current context is Excel.
2. Run `scripts/find-accelerating-growth-trend-rows.js` when the user asks to identify rows with an accelerating growth trend.
Below the workflow, add the following sections that give instructions about the output. Note that Copilot recognizes when the JavaScript has ended in an error state and it can compose and report its own error message, such as "No qualifying table was found." But in scenarios where you need Copilot to report the exact error message returned by the code, you can instruct it do so. The Copilot chat output section illustrates both strategies.
## Workbook output

Let `scripts/find-accelerating-growth-trend-rows.js` create charts, but do not create new worksheets or formulas.

## Copilot chat output

1. For each chart that is created, report the table name and row that is the chart's source.
2. If there are no rows with an accelerating growth trend, report the problem. Use the exact error message that is returned by `scripts/find-accelerating-growth-trend-rows.js`. Do not reword it.
3. If there are any other problems, such as no qualifying tables, report the problem.
Below the output instructions, add the following guidance to Copilot.
## Common pitfalls to avoid

- Do not inspect tables outside the first worksheet.
- Do not analyze a table unless it has at least 12 columns.
- Do not treat the header row as numeric data.
- Do not infer, coerce, or fill missing values.
- Do not run the Office.js script outside Excel.
Task 3: Add workbook data guardrails
In the
skills/accelerating-growth-trend-finder/resourcesfolder create a Markdown file namedworkbook-data-guardrails.md. The resource file keeps scenario-specific workbook assumptions out ofSKILL.md, while still giving Copilot guardrails for when it invokes the script.Give the file the following content.
# Workbook data guardrails

Use this reference before running the accelerating growth trend script.

## Data requirements

- Use only the first worksheet in the current workbook.
- Use the first table on that worksheet that has at least 12 columns.
- Ignore the table header row when checking whether the data is numeric.
- Require every table body cell to contain a finite number.
- Stop at the first table that satisfies the column-count and numeric-data requirements.

## Search rules

- Do not search other worksheets.
- Do not search loose ranges outside Excel tables.
- Do not rename sheets, tables, or headers.
- Do not create helper columns or formulas before running the script.

## Quality checks

- If no table qualifies, report that no qualifying table was found.
- If a table qualifies but no rows match, report that no rows in the qualifying table embody the trend.
- Treat blank cells, text, errors, booleans, and dates that aren't returned as numbers as nonnumeric data.
- If the user requests exponential trend data, report to the user that you will look for accelerating growth trend data, and that while all exponential trends are accelerating growth trends, the converse is not the case, so some of the trends you find may not be exponential.
Task 4: Add Excel execution guidance
In the
skills/accelerating-growth-trend-finder/resourcesfolder, create a Markdown file namedexcel-vs-agent-execution.md. The rules in this file are needed because the skill may be accessible in Copilot outside the context of Excel, in which case the Office.js APIs can't run. If the skill runs outside Excel, Copilot shouldn't pretend that it analyzed the workbook.Give it the following content.
# Excel vs non-Excel execution guidance

## When the skill runs inside Excel

- Use the workbook as the source of truth.
- Follow the instructions in the **Workflow**, **Workbook output**, and **Copilot chat output** sections of the SKILL.md file.

## When the skill runs outside Excel

- Do not claim that workbook rows were analyzed.
- Explain that the skill can only be used in Copilot in Excel.
- Ask the user to open the workbook in Excel and invoke the skill there.

## When to use the scripts folder

- Run `scripts/find-accelerating-growth-trend-rows.js` only when the user asks to find table rows with accelerating, or increasingly larger left-to-right growth.
- Do not run the script for general explanations of accelerating growth growth.
- Do not run the script when the current environment cannot execute Excel Office.js APIs.
Task 5: Add the script that calls Office.js
In the
skills/accelerating-growth-trend-finder/scriptsfolder, create a JavaScript file namedfind-accelerating-growth-trend-rows.js.Give the file the following content. Note the following about this code.
- The script consists of the declaration of a single function and there isn't code that calls the function. Copilot understands that when the skill is invoked, it should call the function.
- The script doesn't call
Office.onReadyor defineOffice.initialize. Copilot creates the runtime, initializes Office.js, and executes skill scripts. - The script is designed to search only the first worksheet. This is to ensure that the skill processes quickly.
- The script is designed to inspect only tables that meet certain conditions. This is to provide multiple error paths to illustrate different ways of handling errors.
- The script calls helper methods that you create in later steps:
findFirstQualifyingTable,hasAcceleratingGrowthTrend, andcreateAndPositionChart. - If the call of
findFirstQualifyingTablereturnsnull, then the script ends with a simplereturn;statement. Copilot will recognize the problem and compose its own error message. - If no rows with accelerating growth are found, and so no charts are created, the script returns an explicit error message. The
SKILL.mdfile instructs Copilot to use exactly this error message. - The function is parameterless because the workbook itself supplies all input.
Note
The preview of Office.js-based skills doesn't support passing parameters to the functions that call Office.js. We're working hard to provide this support in the future.
await Excel.run(async (context) => {
    const firstWorksheet = context.workbook.worksheets.getFirst();

    const tables = firstWorksheet.tables;
    tables.load("items");
    await context.sync();

    const tableInfo = await findFirstQualifyingTable(tables.items);

    if (!tableInfo) {
        return;
    }

    const {
        table: matchingTable,
        tableRange: matchingTableRange,
        dataRange: matchingDataRange
    } = tableInfo;

    let createdCharts = [];

    // Review each row in the qualifying table's data body.
    for (let rowOffset = 0; rowOffset < matchingDataRange.values.length; rowOffset += 1) {
      const row = matchingDataRange.values[rowOffset];

      // If the row doesn't have an accelerating growth trend and there's another row,
      // check the next row. Otherwise, end the row checking loop without creating a chart.
      if (!hasAcceleratingGrowthTrend(row)) {
        continue;
      }

      // The row has an accelerating growth trend, so create a chart for it.
      await createAndPositionChart(firstWorksheet, matchingTable, matchingTableRange, matchingDataRange, rowOffset);

      createdCharts.push({
            tableName: matchingTable.name,
            worksheetRowNumber: matchingDataRange.rowIndex + rowOffset + 1
      });
    }

    await context.sync();

    if (createdCharts.length === 0) {
        return "No rows with an accelerating growth trend were found.";
    }

    return;
});
Add the following helper method at the end of, and inside, the callback to
Excel.run. Note that the method finds the first table in the provided array of tables that qualifies for having a meaningful trend. A qualifying table has:- At least 12 columns.
- At least one data row.
- All numeric values in the data body.
async function findFirstQualifyingTable(tables) {
    for (const table of tables) {
        const tableRange = table.getRange();
        const rows = table.rows;

        table.load("name");
        tableRange.load(["columnCount", "rowIndex", "columnIndex", "rowCount"]);
        rows.load("count");

        await context.sync();

        if (tableRange.columnCount < 12 || rows.count === 0) {
            continue;
        }

        const dataRange = table.getDataBodyRange();

        dataRange.load([ "values", "rowIndex", "rowCount", "columnCount"]);

        await context.sync();

        const isEntirelyNumeric = dataRange.values.every((row) =>
            row.every(
                (value) =>
                    typeof value === "number" &&
                    Number.isFinite(value)
            )
        );

        if (isEntirelyNumeric) {
            return { table,  tableRange, dataRange };
        }
    }

    return null;
}
Add the following helper method at the end of, and inside, the callback to
Excel.run. This method determines whether a row has an accelerating growth trend.function hasAcceleratingGrowthTrend(row) { let previousIncrease = null; for (let columnIndex = 1; columnIndex < row.length; columnIndex += 1) { const increase = row[columnIndex] - row[columnIndex - 1]; if (increase <= 0 || (previousIncrease !== null && increase <= previousIncrease)) { return false; } previousIncrease = increase; } return true; }Add the following helper method at the end of, and inside, the callback to
Excel.run. The method converts a zero-based column index to Excel column letters. The following are examples.- 0 -> A
- 1 -> B
- 25 -> Z
- 26 -> AA
function columnIndexToLetters(columnIndex) {
    let letters = "";
    let n = columnIndex + 1;

    while (n > 0) {
        const remainder = (n - 1) % 26;
        letters = String.fromCharCode(65 + remainder) + letters;
        n = Math.floor((n - 1) / 26);
    }

    return letters;
}
Add the following helper method at the end of, and inside, the callback to
Excel.run. The method creates and positions a line chart for one matching table row. Note the following about this code.- The chart is initially based on the full table range.
- The series for non-matching rows are discarded.
- The chart is positioned one column to the right of the table, is vertically aligned with the matching data row, and is sized to 7 columns wide by 15 rows tall.
async function createAndPositionChart(worksheet, table, tableRange, dataRange, rowOffset) {

    // The worksheet row number, one-based, for the matching data row.
    const worksheetRowNumber = dataRange.rowIndex + rowOffset + 1;

    // ChartSeriesBy.rows means each data row becomes a chart series,
    // while the table headers provide the X-axis category labels.
    const chart = worksheet.charts.add(Excel.ChartType.line, tableRange, Excel.ChartSeriesBy.rows);

    chart.series.load("count");
    await context.sync();

    // Remove every series except the one for the matching row.
    for (let seriesIndex = chart.series.count - 1; seriesIndex >= 0; seriesIndex -= 1) {
        if (seriesIndex !== rowOffset) {
        chart.series.getItemAt(seriesIndex).delete();
        }
    }

    chart.title.text = `${table.name} - Row ${worksheetRowNumber}`;
    chart.title.visible = true;

    // The only chart elements should be axes and gridlines.
    chart.legend.visible = false;

    chart.axes.categoryAxis.visible = true;
    chart.axes.valueAxis.visible = true;

    chart.axes.valueAxis.majorGridlines.visible = true;
    chart.axes.valueAxis.minorGridlines.visible = false;

    chart.dataLabels.showValue = false;
    chart.dataLabels.showCategoryName = false;
    chart.dataLabels.showSeriesName = false;

    // Position the chart one column to the right of the table.
    const chartStartColumn = tableRange.columnIndex + tableRange.columnCount + 1;

    // Align the chart's top edge with the matching data row.
    const chartStartRow = dataRange.rowIndex + rowOffset;

    // Make the chart 7 columns wide and 15 rows tall.
    const chartEndColumn = chartStartColumn + 6;
    const chartEndRow = chartStartRow + 14;

    const startCell = `${columnIndexToLetters(chartStartColumn)}${chartStartRow + 1}`;
    const endCell = `${columnIndexToLetters(chartEndColumn)}${chartEndRow + 1}`;

    chart.setPosition(startCell, endCell);
}
Task 6: Create the manifest
Create a
manifest.jsonfile in the root foldermy-copilot-plugin-skills.Give the file the following content. You add the two icon files in a later step.
{
  "$schema": "https://developer.microsoft.com/json-schemas/teams/v1.29/MicrosoftTeams.schema.json",
  "manifestVersion": "1.29",
  "version": "1.0.0",
  "id": "00000000-0000-0000-0000-000000000000",
  "developer": {
    "name": "Contoso",
    "websiteUrl": "https://www.contoso.com",
    "privacyUrl": "https://www.contoso.com/privacy",
    "termsOfUseUrl": "https://www.contoso.com/terms"
  },
  "name": {
    "short": "Accelerating Growth Trends",
    "full": "Accelerating Growth Trend Finder for Excel"
  },
  "description": {
    "short": "Find Excel table rows with accelerating numeric growth.",
    "full": "A Copilot skill for Excel that uses Office.js to find rows in a workbook table where values increase from left to right with increasingly larger increases."
  },
  "icons": {
    "color": "color.png",
    "outline": "outline.png"
  },
  "accentColor": "#217346",
}
Replace the string
1.29in the first two lines with the number of the latest version of the Microsoft 365 unified manifest schema.Replace the placeholder "id" value with a randomly generated GUID.
Replace developer URLs with values for your app.
Add the following
"agentSkills"to the root object."agentSkills": [ { "folder": "./skills/accelerating-growth-trend-finder" } ]
Note
Although the skill calls Office.js, you don't need an "extensions" section in the manifest to configure a runtime. Copilot in Excel creates the runtime and loads Office.js in it.
Task 7: Add icons
Add the required package icons in the root folder my-copilot-plugin-skills. For details about the size requirements of the icons, see "icons".
Tip
To obtain the required files quickly, use Microsoft 365 Agent Toolkit to create any kind of App for Microsoft 365. The project that is created has the required color.png and outline.png in it, usually in a folder named assets. Copy them into the root of the skill project.
Task 8: Package the skill
From the my-copilot-plugin-skills root, use any ZIP utility to create a ZIP file that contains the manifest, icons, and skills folder at the root of the ZIP. The ZIP file should have the following structure.
|-- manifest.json
|-- color.png
|-- outline.png
|-- skills/
    |-- accelerating-growth-trend-finder/
        |-- SKILL.md
        |-- resources/
            |-- workbook-data-guardrails.md
            |-- excel-vs-agent-execution.md
        |-- scripts/
            |-- find-accelerating-growth-trend-rows.js
Task 9: Test in Excel
Install the package by following the testing guidance in "Step 7: Test" of Build plugins for Copilot Cowork.
Create or open a workbook that has at least one table on the first worksheet that meets the following conditions.
Contains a header row.
Has at least 12 columns.
Contains only numeric values in the table body. (The header row can contain text.)
Has at least the following rows.
- A row that meets both conditions for an accelerating growth trend, as defined earlier in Accelerating growth trend definition.
- A row that meets the first condition, but not the second.
- A row that meets neither condition.
The following is an example of the data in a table that is suitable for testing.
Q1 Q2 Q3 Q4 Q5 Q6 Q7 Q8 Q9 Q10 Q11 Q12 2 4 8 15 27 46 78 130 215 351 570 921 10 20 30 40 50 60 70 80 90 100 110 120 1 97 4018 22 98 506 83 0 5.7 -7 11 5 The first row meets the criteria because both the values and increases strictly grow. The second row doesn't because the increases are constant. The third doesn't because the values don't strictly grow.
Open Copilot in Excel.
Verify that your skill is installed with the following steps.
Select the + icon in the chat area.
The All Skills option in the dropdown that opens will be disabled at first. Wait until it is enabled and then select it.
In the chat text box, start to type @accelerating-growth-trend-finder. The skill should appear in the list of skills.
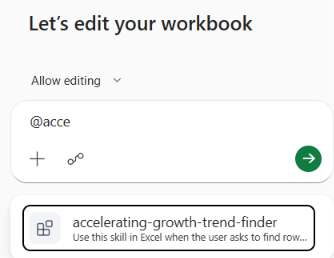
Backspace over the name to clear the chat.
In the chat, ask the skill to find the table rows with an accelerating growth trend. Somewhere in your prompt, you must mention the full name of the skill in the form
@skill-name. In this case, use@accelerating-growth-trend-finder. The following are examples.@accelerating-growth-trend-finder, find rows in this workbook that show an accelerating growth trend.Find rows in this workbook that show an accelerating growth trend using @accelerating-growth-trend-finder.Copilot should invoke the skill, run
find-accelerating-growth-trend-rows.js, create charts of the matching rows, and report the matching worksheet row numbers to the chat, similar to the following two images. Copilot responses in the chat are non-deterministic, so you may see differences from what is in the screenshot below and from one run of the tool to another.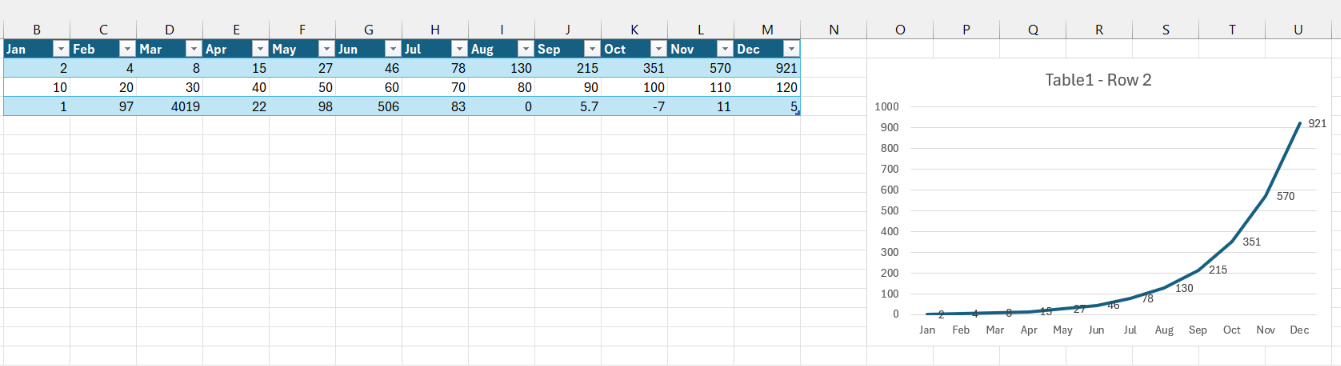
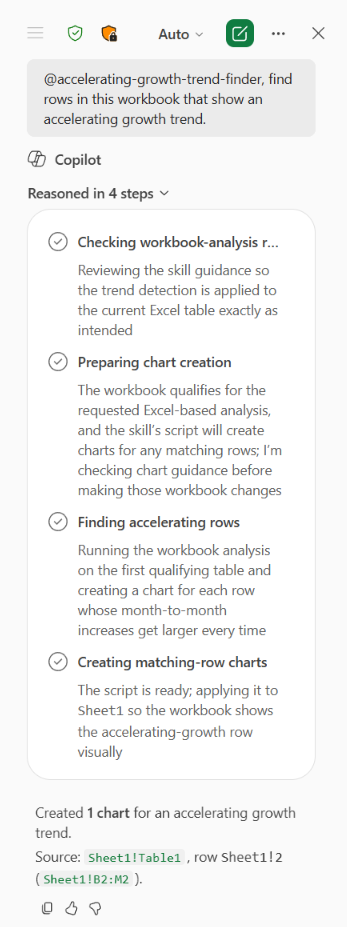
At the top is the user's prompt that reads '@accelerating-growth-trend-finder, find rows in this workbook that show an accelerating growth trend.' Below this Copilot itemizes the four major steps it took with a description of each. In order, they are: '1. Checking workbook-analysis rules. Reviewing the skill guidance so the trend detection is applied to the current Excel table exactly as intended. 2. Preparing chart creation. The workbook qualifies for the requested Excel-based analysis, and the skill’s script will create charts for any matching rows; I’m checking chart guidance before making those workbook changes. 3. Finding accelerating rows. Running the workbook analysis on the first qualifying table and creating a chart for each row whose month-to-month increases get larger every time. 4. Creating matching-row charts. The script is ready; applying it to Sheet1 so the workbook shows the accelerating-growth row visually.' Below this description of steps, Copilot summarizes what it created with the text 'Created 1 chart for an accelerating growth trend.Source: Sheet1!Table1, row Sheet1!2 (Sheet1!B2:M2).'
Change the table so that it doesn't qualify; for example, reduce the number of columns to fewer than 12 or put non-numeric data in one of the table body cells.
Repeat your prompt to Copilot. Copilot should compose its own error message and report it in the chat.
Reverse your changes so that the table qualifies again.
Remove any rows that have an accelerating growth trend.
Repeat the prompt to Copilot. Copilot should report the exact error message in your code: "No rows with an accelerating growth trend were found."
After each test session, uninstall the skill with the following steps.
Open Teams and be sure you're signed in with the same credentials you used to install the skill.
On the Teams app bar, select the apps button.
On the Apps pane, select Manage your apps.
Find the Accelerating Growth Trends add-in in the list of apps.
Select the add-in to expand its row.

Select the trash can icon and then select Remove in the prompt.
Troubleshooting
| Problem | Likely cause | Fix |
|---|---|---|
| The skill doesn't trigger. | The user request doesn't match the skill description, or the skill package isn't installed. | Go through the uninstall procedure and then reinstall the package. |
| Copilot says it can't run the script. | The skill is running outside Excel. | Open the workbook in Excel and invoke the skill there. |
| The wrong table is analyzed. | An earlier table on the first worksheet also qualifies. | Move, rename, or adjust tables so the intended table is the first qualifying table. |
Collaborate with us on GitHub
The source for this content can be found on GitHub, where you can also create and review issues and pull requests. For more information, see our contributor guide.
Office Add-ins