Note
Access to this page requires authorization. You can try signing in or changing directories.
Access to this page requires authorization. You can try changing directories.
In some environments, a debugger can be attached on an Office Add-in that is already running. This can be useful when you want to debug an add-in that is already in staging or production. If you are still developing and testing the add-in, see Overview of debugging Office Add-ins.
The technique described in this article can be used only when the add-in is running in Office on Windows.
To launch the debugger, choose the top right corner of the task pane to activate the Personality menu (as shown in the red circle in the following image).
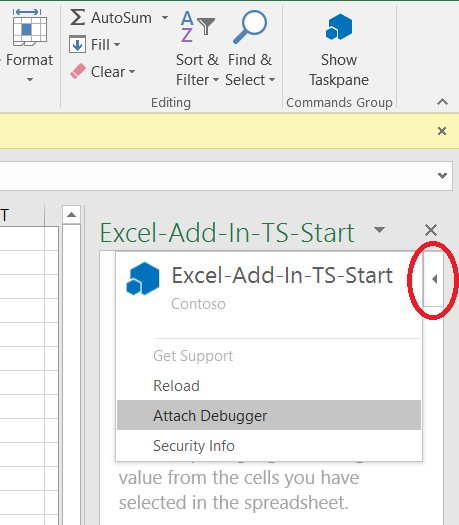
Select Attach Debugger. This launches the Microsoft Edge developer tools. Use the tools as described in Debug add-ins using developer tools in Microsoft Edge.
See also
Collaborate with us on GitHub
The source for this content can be found on GitHub, where you can also create and review issues and pull requests. For more information, see our contributor guide.
Office Add-ins