Note
Access to this page requires authorization. You can try signing in or changing directories.
Access to this page requires authorization. You can try changing directories.
PivotTables let you analyze large collections of data quickly. With their power comes complexity. The Office Scripts APIs let you customize a PivotTable to suit your needs, but the scope of the API set makes getting started a challenge. This article demonstrates how to perform common PivotTable tasks and explains important classes and methods.
Note
To better understand context for the terms used by the APIs, read Excel's PivotTable documentation first. Start with Create a PivotTable to analyze worksheet data.
Object model
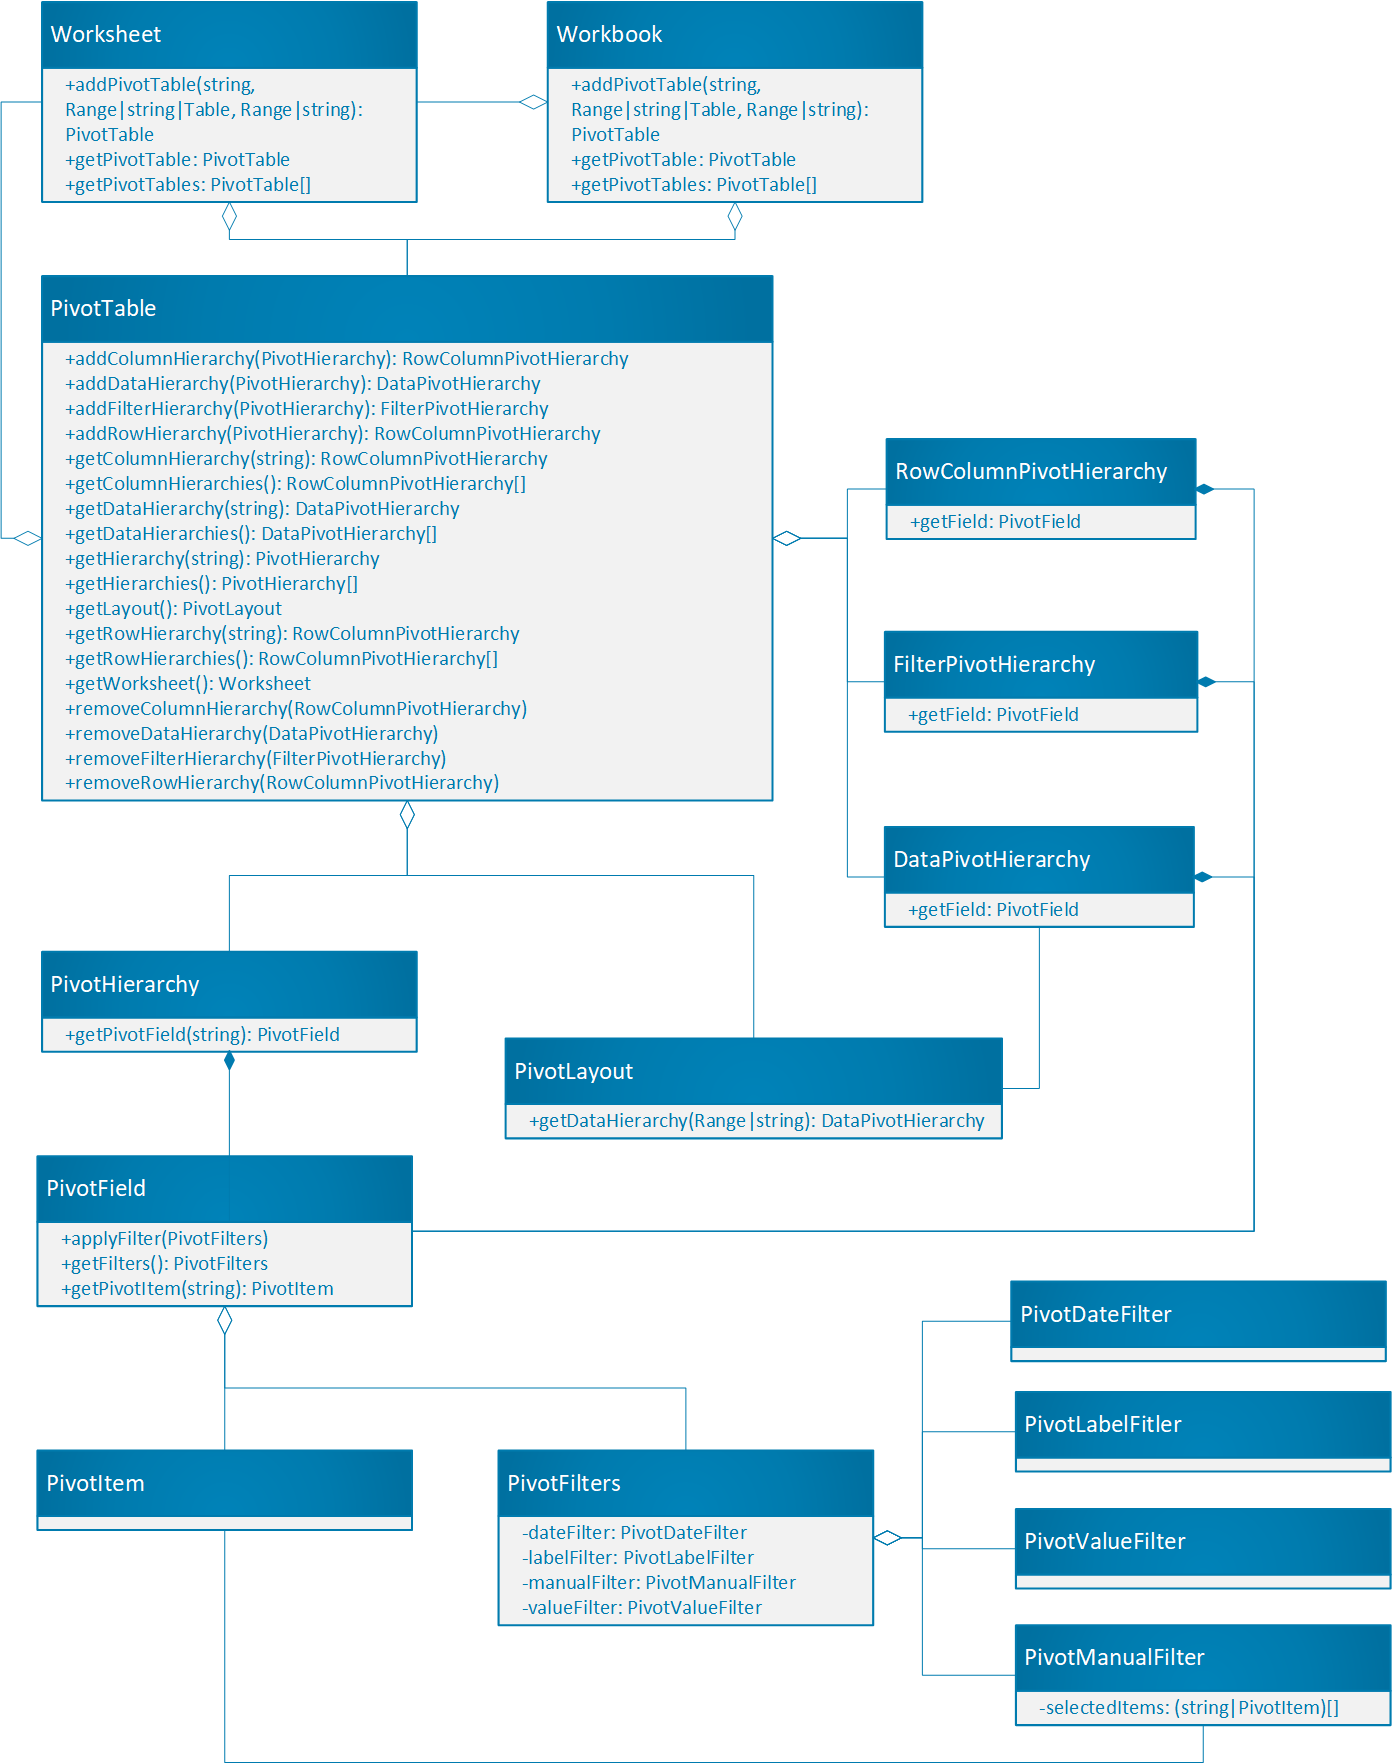
The PivotTable is the central object for PivotTables in the Office Scripts API.
- The Workbook object has a collection of all the PivotTables. Each Worksheet also contains a PivotTable collection that's local to that sheet.
- A PivotTable contains PivotHierarchies. A hierarchy can be thought of as a column in a table.
- PivotHierarchies can be added as rows or columns (RowColumnPivotHierarchy), data (DataPivotHierarchy), or filters (FilterPivotHierarchy).
- Each PivotHierarchy contains exactly one PivotField. PivotTable structures outside of Excel may contain multiple fields per hierarchy, so this design exists to support future options. For Office Scripts, fields and hierarchies map to the same information.
- A PivotField contains multiple PivotItems. Each PivotItem is a unique value in the field. Think of each item as a value in the table column. Items could also be aggregated values, such as sums, if the field is being used for data.
- The PivotLayout defines how the PivotFields and PivotItems are displayed.
- PivotFilters filter data from the PivotTable using different criteria.
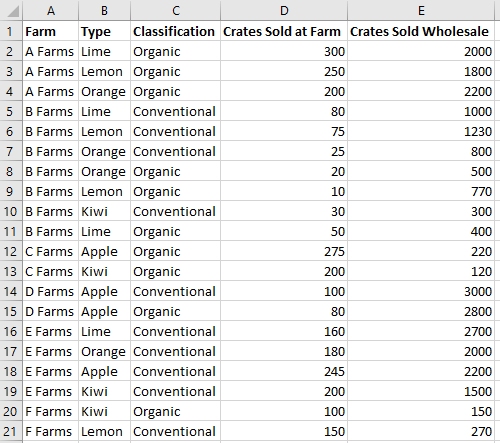
To look at how these relationships work in practice, start by downloading the sample workbook. That data describes fruit sales from various farms. It's the base for all the examples in this article. Run the sample scripts throughout the article to create and explore PivotTables.
Create a PivotTable with fields
PivotTables are created with references to existing data. Both ranges and tables can be the source for a PivotTable. They also need a place to exist in the workbook. Since the size of a PivotTable is dynamic, only the upper-left corner of the destination range is specified.
The following code snippet creates a PivotTable based on a range of data. The PivotTable has no hierarchies, so the data is not yet grouped in any way.
const dataSheet = workbook.getWorksheet("Data");
const pivotSheet = workbook.getWorksheet("Pivot");
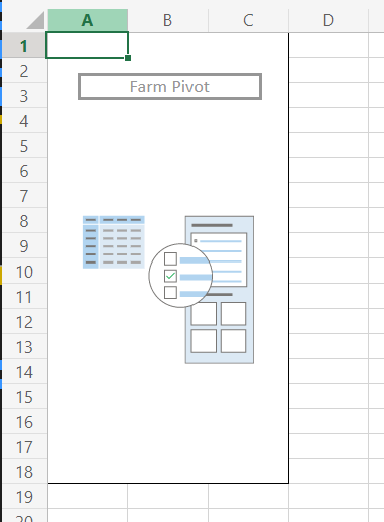
const farmPivot = pivotSheet.addPivotTable(
"Farm Pivot", /* The name of the PivotTable. */
dataSheet.getUsedRange(), /* The source data range. */
pivotSheet.getRange("A1") /* The location to put the new PivotTable. */);
Hierarchies and fields
PivotTables are organized through hierarchies. Those hierarchies are used to pivot data when added as a specific type of hierarchy. There are four types of hierarchies.
- Row: Displays items in horizontal rows.
- Column: Displays items in vertical columns.
- Data: Displays aggregates of values based on the rows and columns.
- Filter: Add or removes items from the PivotTable.
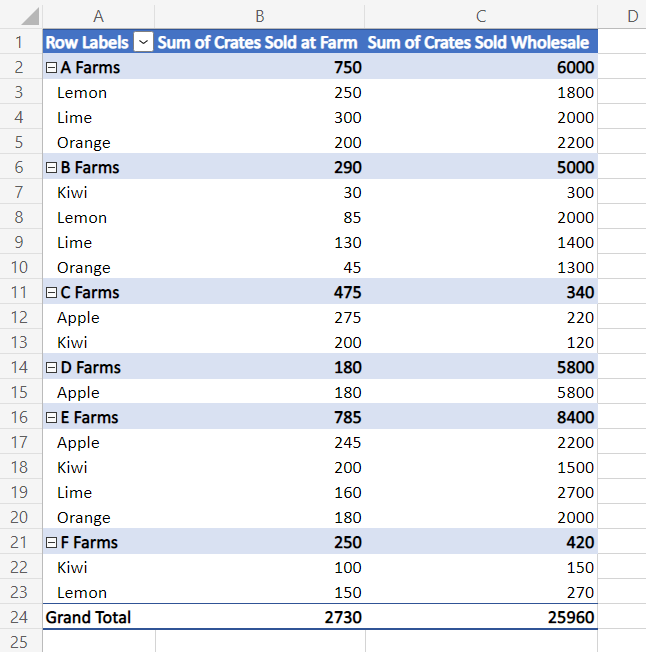
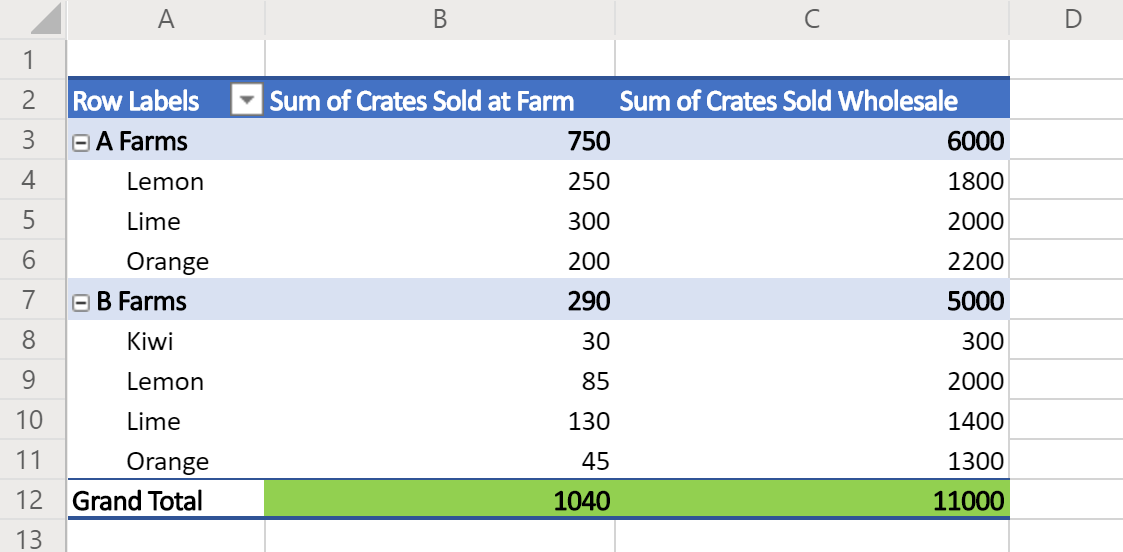
A PivotTable can have as many or as few of its fields assigned to these specific hierarchies. A PivotTable needs at least one data hierarchy to show summarized numerical data and at least one row or column to pivot that summary on. The following code snippet adds two row hierarchies and two data hierarchies.
  farmPivot.addRowHierarchy(farmPivot.getHierarchy("Farm"));
  farmPivot.addRowHierarchy(farmPivot.getHierarchy("Type"));
  farmPivot.addDataHierarchy(farmPivot.getHierarchy("Crates Sold at Farm"));
  farmPivot.addDataHierarchy(farmPivot.getHierarchy("Crates Sold Wholesale"));
Layout ranges
Each part of the PivotTable maps to a range. This lets your script get data from the PivotTable for use later in the script or to be returned in a Power Automate flow. These ranges are accessed through the PivotLayout object acquired from PivotTable.getLayout(). The following diagram shows the ranges that are returned by the methods in PivotLayout.
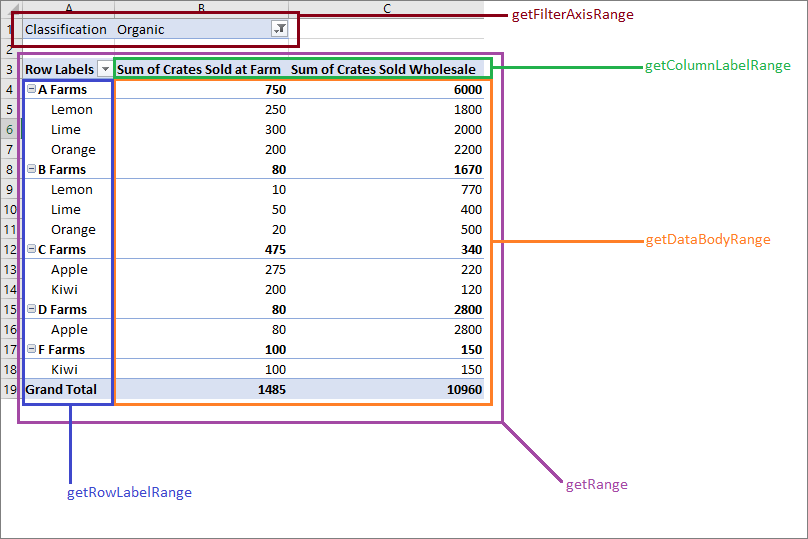
PivotTable total output
The location of the total row is based on the layout. Use PivotLayout.getBodyAndTotalRange and get the last row of the column to use the data from the PivotTable in your script.
The following sample finds the first PivotTable in the workbook and logs the values in the "Grand Total" cells (as highlighted in green in the image below).
function main(workbook: ExcelScript.Workbook) {
  // Get the first PivotTable in the workbook.
  const pivotTable = workbook.getPivotTables()[0];

  // Get the names of each data column in the PivotTable.
  const pivotColumnLabelRange = pivotTable.getLayout().getColumnLabelRange();

  // Get the range displaying the pivoted data.
  const pivotDataRange = pivotTable.getLayout().getBodyAndTotalRange();

  // Get the range with the "grand totals" for the PivotTable columns.
  const grandTotalRange = pivotDataRange.getLastRow();

  // Print each of the "Grand Totals" to the console.
  grandTotalRange.getValues()[0].forEach((column, columnIndex) => {
    console.log(`Grand total of ${pivotColumnLabelRange.getValues()[0][columnIndex]}: ${grandTotalRange.getValues()[0][columnIndex]}`);
    // Example log: "Grand total of Sum of Crates Sold Wholesale: 11000"
  });
}
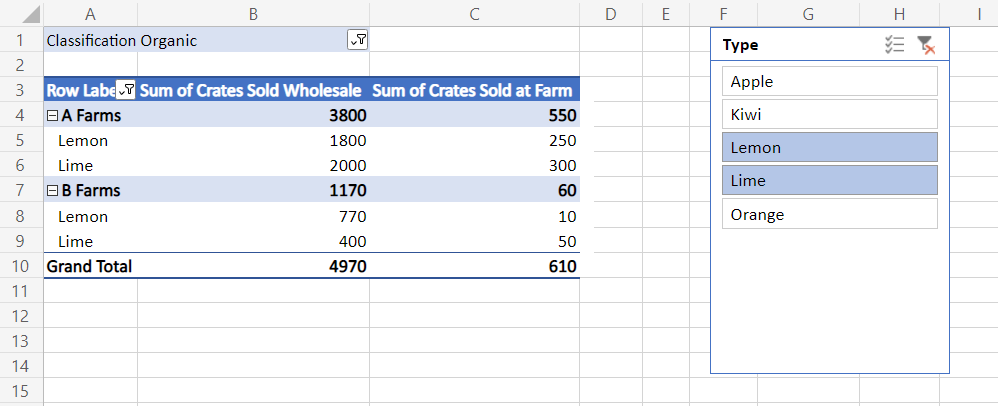
Filters and slicers
There are three ways to filter a PivotTable.
FilterPivotHierarchies
FilterPivotHierarchies add an additional hierarchy to filter every data row. Any row with an item that is filtered out is excluded from the PivotTable and its summaries. Since these filters are based on items, they only work on discrete values. If "Classification" is a filter hierarchy in the sample, users can select the values of "Organic" and "Conventional" for the filter. Similarly, if "Crates Sold Wholesale" is selected, the filter options would be the individual numbers, such as 120 and 150, instead of numerical ranges.
FilterPivotHierarchies are created with all values selected. This means that nothing is filtered until the user manually interacts with the filter control or a PivotManualFilter is set on the field belonging to the FilterPivotHierarchy.
The following code snippet adds "Classification" as a filter hierarchy.
farmPivot.addFilterHierarchy(farmPivot.getHierarchy("Classification"));
PivotFilters
The PivotFilters object is a collection of filters applied to a single field. Since each hierarchy has exactly one field, you should always use the first field in PivotHierarchy.getFields() when applying filters. There are four filter types.
- Date filter: Calendar date-based filtering.
- Label filter: Text comparison filtering.
- Manual filter: Custom input filtering.
- Value filter: Number comparison filtering. This compares items in the associated hierarchy with values in a specified data hierarchy.
Typically, only one of the four types of filters is created and applied to the field. If the script tries to use incompatible filters, an error is thrown with the text "The argument is invalid or missing or has an incorrect format."
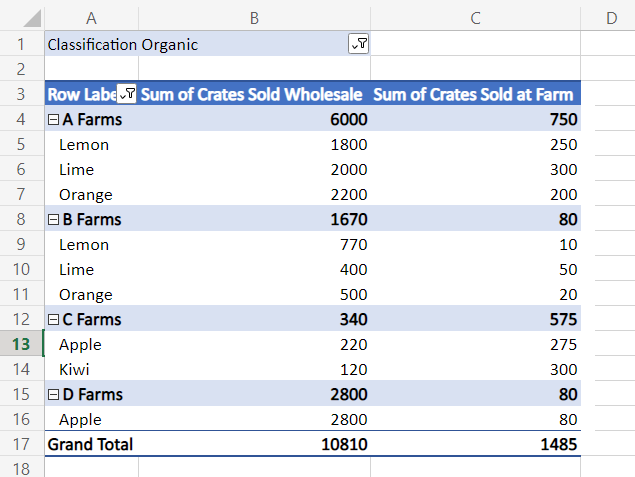
The following code snippet adds two filters. The first is a manual filter that selects items in an existing "Classification" filter hierarchy. The second filter removes any farms that have fewer than 300 "Crates Sold Wholesale". Note that this filters out the "Sum" of those farms, not the individual rows from the original data.
  const classificationField = farmPivot.getFilterHierarchy("Classification").getFields()[0];
  classificationField.applyFilter({
    manualFilter: {
      selectedItems: ["Organic"] /* The included items. */
    }
  });

  const farmField = farmPivot.getHierarchy("Farm").getFields()[0];
  farmField.applyFilter({
    valueFilter: {
      condition: ExcelScript.ValueFilterCondition.greaterThan, /* The relationship of the value to the comparator. */
      comparator: 300, /* The value to which items are compared. */
      value: "Sum of Crates Sold Wholesale" /* The name of the data hierarchy. Note the "Sum of" prefix. */
      }
  });
Slicers
Slicers filter data in a PivotTable (or standard table). They are moveable objects in the worksheet that allow for quick filtering selections. A slicer operates in a similar fashion to the manual filter and PivotFilterHierarchy. Items from the PivotField are toggled to include or exclude them from the PivotTable.
The following code snippet adds a slicer for the "Type" field. It sets the selected items to be "Lemon" and "Lime", then moves the slicer 400 pixels to the left.
  const fruitSlicer = pivotSheet.addSlicer(
    farmPivot, /* The table or PivotTale to be sliced. */
    farmPivot.getHierarchy("Type").getFields()[0] /* What source to use as the slicer options. */
  );
  fruitSlicer.selectItems(["Lemon", "Lime"]);
  fruitSlicer.setLeft(400);
Value field settings for summaries
Change how the PivotTable summarizes and displays data with these settings. The field in each data hierarchy can display the data in different ways, such as percentages, standard deviations, and relative comparisons.
Summarize by
The default summarization of a data hierarchy field is as a sum. DataPivotHierarchy.setSummarizeBy lets you combine the data for each row or column in a different way. AggregationFunction lists the all the available options.
The following code snippet changes "Crates Sold Wholesale" to show each item's standard deviation, instead of the sum.
  const wholesaleSales = farmPivot.getDataHierarchy("Sum of Crates Sold Wholesale");
  wholesaleSales.setSummarizeBy(ExcelScript.AggregationFunction.standardDeviation);
Show values as
DataPivotHierarchy.setShowAs applies a calculation to the values of a data hierarchy. Instead of the default sum, you can show values or percentages relative to other parts of the PivotTable. Use a ShowAsRule to set how data hierarchy values are shown.
The following code snippet changes the display for "Crates Sold at Farm". The values will be shown as a percentage of the grand total for the field.
  const farmSales = farmPivot.getDataHierarchy("Sum of Crates Sold at Farm");

  const rule : ExcelScript.ShowAsRule = {
    calculation: ExcelScript.ShowAsCalculation.percentOfGrandTotal
  };
  farmSales.setShowAs(rule);
Some ShowAsRules need another field or item in that field as a comparison. The following code snippet again changes the display for "Crates Sold at Farm". This time, the field will show each value's difference from the value of the "Lemons" in that farm row. If a farm has not sold any lemons, the field shows "#N/A".
  const typeField = farmPivot.getRowHierarchy("Type").getFields()[0];
  const farmSales = farmPivot.getDataHierarchy("Sum of Crates Sold at Farm");

  const rule: ExcelScript.ShowAsRule = {
    calculation: ExcelScript.ShowAsCalculation.differenceFrom,
    baseField: typeField, /* The field to use for the difference. */
    baseItem: typeField.getPivotItem("Lemon") /* The item within that field that is the basis of comparison for the difference. */
  };
  farmSales.setShowAs(rule);
  farmSales.setName("Difference from Lemons of Crates Sold at Farm");
See also
Collaborate with us on GitHub
The source for this content can be found on GitHub, where you can also create and review issues and pull requests. For more information, see our contributor guide.
Office Scripts