Note
Access to this page requires authorization. You can try signing in or changing directories.
Access to this page requires authorization. You can try changing directories.
Returns or sets the color of the border, font, or interior, as shown in the following table. The color is specified as an index value into the current color palette, or as one of the following XlColorIndex constants: xlColorIndexAutomatic or xlColorIndexNone. Read/write Variant.
Syntax
expression.ColorIndex
expression Required. An expression that returns one of the objects in the Applies To list.
Remarks
| Object | Description |
|---|---|
| Border | The color of the border. |
| Font | The color of the font. |
| Interior | The color of the interior fill. Set ColorIndex to xlColorIndexNone to specify that you don't want an interior fill. Set ColorIndex to xlColorIndexAutomatic to specify the automatic fill (for drawing objects). |
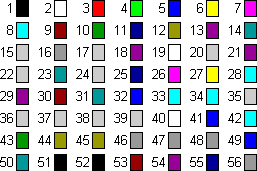
This property specifies a color as an index into the color palette. The following illustration shows the color-index values in the default color palette.

Example
The following examples assume that you are using the default color palette.
This example sets the color of the major gridlines for the value axis.
With myChart.Axes(xlValue)
 If .HasMajorGridlines Then
 'Set color to blue
 .MajorGridlines.Border.ColorIndex = 5
 End If
End With
This example sets the color of the chart area interior to red, and sets the border color to blue.
With myChart.ChartArea
 .Interior.ColorIndex = 3
 .Border.ColorIndex = 5
End With
Note
If you would like to use color with FormatCondition in Visual Basic, see the Interior.ColorIndex property.
Support and feedback
Have questions or feedback about Office VBA or this documentation? Please see Office VBA support and feedback for guidance about the ways you can receive support and provide feedback.