Note
Access to this page requires authorization. You can try signing in or changing directories.
Access to this page requires authorization. You can try changing directories.
Returns population covariance, the average of the products of deviations for each data point pair.
Syntax
expression.Covariance_P (Arg1, Arg2)
expression A variable that represents a WorksheetFunction object.
Parameters
| Name | Required/Optional | Data type | Description |
|---|---|---|---|
| Arg1 | Required | Variant | The first cell range of integers. |
| Arg2 | Required | Variant | The second cell range of integers. |
Return value
Double
Remarks
Use Covariance_P to determine the relationship between two data sets. For example, you can examine whether greater income accompanies greater levels of education.
The arguments must either be numbers or be names, arrays, or references that contain numbers.
If an array or reference argument contains text, logical values, or empty cells, those values are ignored; however, cells with the value zero are included.
If Arg1 and Arg2 have different numbers of data points, Covariance_P generates an error.
If either Arg1 or Arg2 is empty, Covariance_P generates an error.
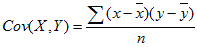
The covariance is as follows, where x and y are the sample means AVERAGE(array1) and AVERAGE(array2), and n is the sample size:
Support and feedback
Have questions or feedback about Office VBA or this documentation? Please see Office VBA support and feedback for guidance about the ways you can receive support and provide feedback.