Office 365 usage dashboard - Cloud product performance
Appropriate roles: Admin agent | Report viewer | Executive report viewer
The Office 365 usage report provides usage data for the Office 365 subscriptions that you sold or manage for your customers. You can view the following sections from the Office 365 usage report.
- Summary
- Office 365 usage by geography
- Office 365 usage by workload
- Subscriptions performance
- Office 365 usage distribution
Note
This report is available from the Insights dashboard. To view this report, you must be assigned a specific role in Partner Center, such as Account admin, Report viewer, or Executive report viewer. Specific types of data in this report might also be available only to users with Executive report viewer privileges. Learn more about User roles and Permissions.
Summary
The summary section presents a snapshot view of the key indicators related to Office 365 subscriptions that you sold or manage for your customers.
New subscriptions: Total number of subscriptions sold or managed during the selected timeframe.
The Micro chart presents a month-over-month trend of New subscriptions count for your selected date range.
Available seats: Total number of licenses sold during the selected timeframe.
The Micro chart presents a month-over-month trend of the licenses sold count during your selected date range.
Monthly Active Users: Number of users who used the workload during the previous month.
The Micro chart presents a monthly trend of monthly active users over the selected time period.

Office 365 usage by geography
This view gives geographical distribution of Office 365 apps for Paid available units and Monthly active users. Switch between the tabs to view the numbers for different countries/regions.

Office 365 usage by workload
The Office 365 usage by workload depicts the Breakdown of MAU and PAU by workloads.

Subscriptions performance
The Subscriptions performance depicts the Breakdown of MAU and PAU by workloads per customer. Data for the top 100 customers by billed revenue is shown in the table. You can search for any customer or download the raw data to view details for all customers.

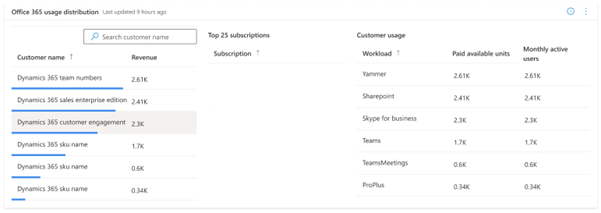
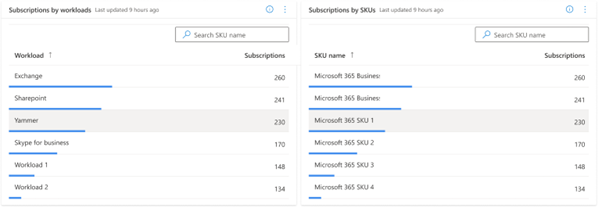
Office 365 usage distribution
The Office 365 usage distribution depicts the Breakdown of PAU and Subscriptions by SKUs.

Related content
- For more reports, see Partner Center Insights.
- You can download the raw data powering this report from the Download Reports section in the Insights dashboard.