Note
Access to this page requires authorization. You can try signing in or changing directories.
Access to this page requires authorization. You can try changing directories.
This article explains how to review code app data requests and responses in browser dev tools.
Browser developer tools (DevTools) are built-in tools in modern web browsers that let you inspect network traffic, view console logs, debug JavaScript, and examine HTML/CSS. You can open DevTools by pressing F12 or Ctrl+Shift+I, or by right-clicking a page element and choosing Inspect (on macOS use Command+Option+I). For detailed guidance, review the browser documentation:
Prerequisites
You have a code app that connects to data as described in these articles:
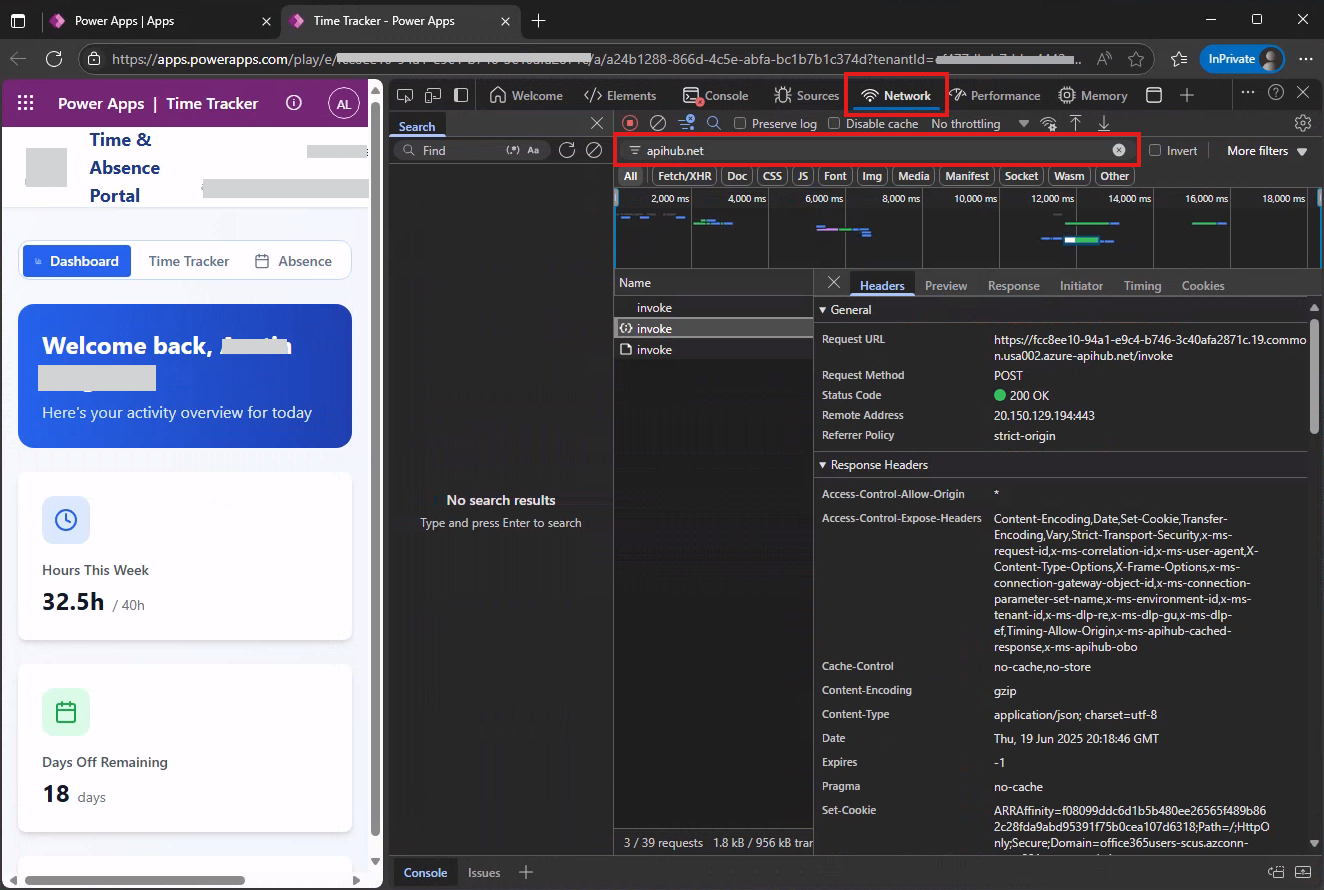
View data requests in browser dev tools
You can filter data requests using these strings:
| Data source | Filter string |
|---|---|
| Connectors | apihub.net |
| Dataverse | dynamics.com |
This screenshot shows how to filter requests to connectors using dev tools in Edge using the apihub.net filter.