Understanding insights (preview)
[This topic is pre-release documentation and is subject to change.]
Performance insights distributes insights into the following categories:
- Overall performance
- Client environment
- Usage pattern
- Page performance
- Customization
- Configuration
- Network As the performance of an app could be impacted by various factors, performance insights categorizes areas to check how much overhead of performance get caused by.
Overall performance
This insight summarizes the overall performance of your app as an executive summary under the Insight ID Perf.Summary.Overview.
In this insight, you can see the overall performance of your app based on the severity.
- Critical: Indicates poor performance.
- Warning: Indicates performance could be improved.
- Informational: Indicates good performance.
How to improve
When it comes time to optimize the app, you can look at the detailed insights from the client, network, customization categories as well as plugins, savedQeury, and settings. Some actionable items can be derived by reviewing those insights.
Client environment
When users experience a Power Apps app on their devices, several factors can affect performance such as browser type, browser version, and specification of hardware. In this section, you can see what insights check client environments.
Browser type
Insight ID: Perf.Environment.Client.Browser.Type
Motivation
Certain web browser types can impact the performance of your app. Using unsupported or non-modern browsers can lead to slow performance. This insight provides the performance implications of different browsers, especially non-recommended browsers. For example, Power Apps has deprecated it's support of Internet Explorer.
How to improve
If you have users on old browsers such as Internet Explorer, switch to a modern Chromium-based browser. We recommend that users run a modern browser, such as Microsoft Edge or Google Chrome.
Note
Some legacy applications leveraging NPAPI will only work on Internet Explorer.
Browser version
Insight ID: Perf.Environment.Client.Browser.Version
Motivation
This insight checks how many users are using your app from an old version of a browser. Even when users run modern browsers, and not non-recommended browser types like Internet Explorer, older versions of browsers perform slower.
How to improve
Users should regularly update the browser to the latest version. Enterprise customers can apply a group policy to be on a specific version. As Unified Service Desk (USD) also uses the default browser setting of the computer, it also requires checking the default browser type and version.
Minimum system requirements
Insight ID: Perf.Environment.Device.MimimumRequirements
Motivation
This insight checks whether the user’s environment meets minimum system requirements. You can check the web application requirements to see what are the minimum system requirements depending on the app type.
In general, some activities like rendering, scripting, and downloading contents happen on the client side. Meeting the minimum system requirements is necessary for such activities.
How to improve
Users should use the hardware that meets or exceeds the minimum system requirements for Power Apps.
HTTP protocol
Insight ID: Perf.Environment.Client.Browser.HttpProtocol
Motivation
Power Apps platform supports HTTP/2. However, if your app is using the HTTP/1.1 protocol for XMLHttpRequest (XHR) requests onto Power Apps, it might cause slow performance due to the concurrent limitation of requests with the HTTP/1.1 protocol.
How to improve
If this insight identified some users who are using the HTTP/1.1 protocol, we strongly recommend that these user’s client support the HTTP/2 protocol.
Several configurations and network infrastructure can block the HTTP/2 protocol, such as a VPN network, proxy server, or device internet option settings.
Users can check what protocol has been used from a development tool included with the browser. In the figure below, network calls occurred over HTTP/2.
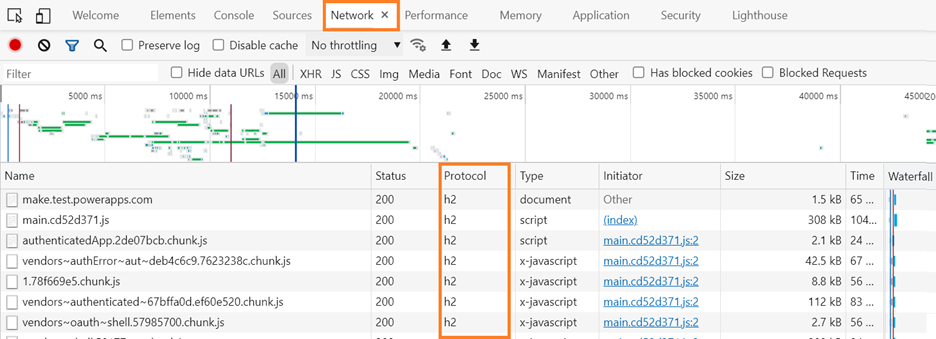
If the network protocol trace indicates HTTP/1.1, it might be because of the following:
- Internet settings: The Windows Internet Option Advanced tab in Control Panel Use HTTP2 and Use TLS 1.2 options aren't enabled.
- VPN and proxy: Although the Windows Internet Option is set to use HTTP2 and TLS 1.2, the browser might fall back when a VPN or Proxy doesn’t support the more recent protocols.
Usage pattern
This category analyzes the type of page loads. A warm page load renders the page using caches and existing DOM objects, while a cold page load renders the page fresh by downloading resources when required. Although users will not distinguish the type of page load, this insight analyzes and provides recommendations depending on what type of page loads occur on the client.
Page load type
Insight ID: Perf.Performance.PageLoadType
Motivation
Warm page loads are faster than cold page loads since necessary resources load out of local caches.
Note
When a user opens a form from new tab or new tab in a browser, it is considered a cold page load. When a user opens other forms in the app within the active tab of a browser, it is considered a warm page load.
How to improve
To experience warm page loads for faster performance, minimize opening new tabs or browser windows. Try to keep activities within a single tab instead of opening new tabs or browser windows. We also recommend not to run the browser in InPrivate or incognito mode.
Page performance
Many first party model-driven apps consist of a dashboard, views (EntityList), and form when it comes to page type. By default, users load a dashboard, although app makers and administrators can change this. If a dashboard contains many charts and tiles, it might cause the dashboard to load slowly. Similarly, if EntityList and forms get customized to add many columns and display many records, it can also cause the page to load slow. Hence, checking the performance per page and per table can be beneficial because page load performance can have different root causes.
In this section, you can see several insights related to page performance.
Slow dashboards
Insight ID: Perf.ModelDriven.Page.Dashboard.SlowSQLQuery
Motivation
Slow SQL queries or using too many charts and tiles in a dashboard can cause poor performance of the dashboard. This insight points to the dashboards that are affected by slow SQL queries. When this insight is recorded, the Details pane includes the dashboard ID for each dashboard included in the insight.
How to improve
Here's how to look up the name of dashboard using the dashboard ID. Then, you can determine which dashboards to consider for redesign.
Go to your model-driven app, such as https://contoso.crm.dynamics.com.
Modify the URL as shown in this example (https://contoso.dynamics.com/api/data/v9.1/systemforms[DashboardId]/name) by appending api/data/v9.1/systemforms[DashboardId]/name to the app URL.
You will receive OData request similar to the below. Agent Dashboard displayed below represents the user-friendly name of the given dashboard ID.
{"@odata.context":https://contoso.crm.dynamics.com/api/data/v9.1/$metadata#systemforms(2ff4a8cf-378b-e811-a964-000d3a30dc0a)/name,"value":"Contoso - Agent Dashboard"}
Synchronous plug-ins with slow external calls
Insight ID: Perf.Sandbox.Performance.Plug-ins.ExternalCall
Plug-ins and custom workflow activities can access web services (external endpoints) via HTTP and HTTPS protocols. If these external services perform slowly, the plug-in itself will timeout or perform slowly.
Motivation
This insight checks the performance of the external endpoints and detects plug-ins in your app that are impacted by the slow external calls.
How to improve
- Set KeepAlive to false when interacting with external hosts in a plug-in.
- Set Timeout explicitly when making external calls in a plug-in.
More information: Access external web services (Microsoft Dataverse) - Power Apps | Microsoft Docs.
Customization
Makers can do many different customizations with model-driven apps, such as:
- Ingest custom JavaScript functions to enable events on the client.
- Build and deploy plug-ins used to execute custom logic.
- Define and store custom tables and data.
- Define dependent components for both custom and standard tables, such as forms and views.
From a performance perspective, all of these customizations might cause poor app response in situations where the customization doesn't follow best practices and recommendations. Makers can run Solution Checker to validate their customizations during the development phase.
The following insights also provide analytic results out of runtime user data of your customization.
XML HTTP Request (XHR) call type
Insight ID: Perf.ModelDriven.Customization.Client.Script.XMLHttpRequestType
Synchronous XMLHttpRequest calls can cause severe performance issues for end users, especially when the network is slow or there are multiple calls that need to be made. The browser freezes up and the end user is frustrated when they can't click, scroll, or interact with the page.
This insight reveals whether there are synchronous methods and indicates the related performance.
Motivation
Synchronous XHR calls will block the browser from performing more work as the browser must wait for the synchronous call to complete causing the page to slow down or freeze completely.
How to improve
We recommend that you change the top methods mentioned in the Data Section of the insight from synchronous to asynchronous. More information: Turbocharge your model-driven apps by transitioning away from synchronous requests
Deprecated controls
Insight ID: Perf.Customization.Controls.Deprecated
Some older controls for model-driven apps like Flip Switch, Calendar Control (V1), Linear Slider, Radial Knob, Arc Knob, Linear Gauge; along with the Website Preview control, MultiSelectPicklistControl (V1), and the Flip Label are deprecated. Some of these controls can be replaced with the new controls, which are more in line with the modern web and mobile in mind. More information: New Model Driven Apps controls, deprecation of old controls
Motivation
Using outdated controls can cause performance, reliability, and accessibility issues. Moreover, some of the limitations in these deprecated controls have been resolved with the new controls. For example, the Toggle control and Calendar Control (V2) use Microsoft Fluent UI.
How to improve
- Use the Toggle control as a replacement for Flip Label and Flip Switch.
- Use Calendar Control (V2) as a replacement for Calendar Control (V1).
- Evaluate other deprecated controls to determine if they are still useful within existing forms.
Notice that there are few significant design changes between the deprecated version and the new controls.
For more information about the deprecated controls, go to Model-driven app controls deprecation.
Sandbox performance - dominant plug-ins
Insight ID: Perf.Sandbox.Performance.Plug-ins.Dominant
This insight will help us identify the dominant plug-in, or in other words, the one that's most used. It will also indicate if any of the dominantly used plug-ins performed slow with a plugin execution time greater than 100 milliseconds in the 95th percentile. This insight will list up to three dominant plug-ins.
Motivation
Slow dominant plug-ins affect performance. These plug-ins should be investigated.
How to improve
Investigate slow performing plug-ins. Check out the best practices regarding plug-in and workflow development.
To further investigate the slow plug-in, you can set the Plug-in trace log settings to All in your development or test environment and determine where the delay is. However, don’t forget to disable the setting before going to production. More information: Tracing and logging
Investigate slow performing plug-ins. Some of the reasons for slow plug-ins are described here:
- Associated SQL queries performed slow, hence the plug-in execution time increased.
- Follow the single responsibility principle for your plug-in and don’t make transactions with significant transaction boundaries.
- Plug-in might be making some external calls, which are slow.
- Plug-in logic isn't optimized for multi-threading environments. Check your code.
To further investigate the slow plug-in, you can set the Plug-in trace log settings to All in your development or test environment and determine where the delay is. Don’t forget to disable the setting before going to production. More information: Tracing and logging
Saved query with leading wildcard
Insight ID: Perf.ModelDriven.Customization.SavedQuery.LeadingWildCard
Leading wildcards are like or not like conditions that use a wildcard (%) at the start of a search string. An example of a poorly written request is:
<fetch version="1.0" output-format="xml-platform" mapping="logical">
    <entity name="account">
        <attribute name="accountid" />
        <attribute name="accountnumber" />
        <filter type="and">
            <condition attribute="accountnumber" operator="like" value="%124" />
        </filter>
    </entity>
</fetch>
Motivation
A leading wildcard character (%) in a saved query can cause the query to timeout or perform slowly. This insight points to such slow saved queries with leading wildcards.
How to improve
Avoid using leading wildcards. In the search key, these are translated to “contains” in SQL Server, which won’t take the advantage of index seek but will do a scan. If it is necessary to use a leading wildcard, limit the scope of search by including other conditions. Note that it is ok to use trailing wildcards (%) at the end of search strings.
Configuration
Plug-in trace log setting
Insight ID: Perf.Sandbox.Configuration.PluginTraceSettings
Makers can debug their plug-ins through plug-in trace logs. The Dataverse admins can set plug-in and custom workflow activity tracing to Off, Exception, or All.
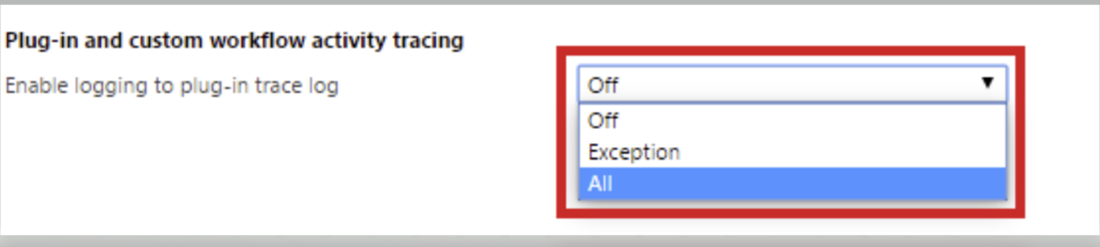
Motivation
The plug-in trace log should be set to All only when you're debugging or tweaking the plug-in. High volume of trace logging can cause I/O overhead with SQL Server. Moreover, deletion of the plug-in trace log might cause blocks or waits with SQL Server.
How to improve
In your production instance if this setting is All and the volume of logs generated by your plugin is high, then consider changing it to Exception.
To change the setting, go to Settings > Administration > System Settings > Customization tab. More information: Logging and tracing
Network
Network performance
Network latency and throughput are important factors that affect end user’s experience. Users with high latency and low throughput will more likely experience slow performance while accessing Unified Interface. This insight tells us how many users are on a poor performing network and what their performance was like.
Motivation
Poor network configuration will affect app performance.
How to improve
If there are many users on the network and the performance is poor, we recommend the users switch to a better performing network.