Note
Access to this page requires authorization. You can try signing in or changing directories.
Access to this page requires authorization. You can try changing directories.
After exporting data from Microsoft Dataverse to Azure Data Lake Storage Gen2 with Azure Synapse Link for Dataverse, you can use Power BI to create business reports and analytics. This can be useful for sales managers and sales associates to refine and build additional reports and dashboards in Power BI.
Note
Azure Synapse Link for Dataverse was formerly known as Export to data lake. The service was renamed effective May 2021 and will continue to export data to Azure Data Lake as well as Azure Synapse Analytics.
This article shows you how to perform the following tasks:
Connect the Data Lake Storage Gen2 storage container containing the exported Dataverse data to Power BI.
Create a report in Power BI that graphs account owners and their respective total account revenue.
Prerequisites
This section describes the prerequisites necessary to consume Dataverse data with Power BI by using the Azure Synapse Link for Dataverse service.
Power BI Desktop. Get it now
Azure Synapse Link for Dataverse. This guide assumes that you have already exported data from Dataverse by using the Azure Synapse Link for Dataverse. In this example, the account table data is exported to the data lake and will generate a report by using the account table columns.
Storage Account Access. You must be granted one of the following roles for the storage account: Storage Blob Data Reader, Storage Blob Data Contributor, or Storage Blob Data Owner.
Connect the Data Lake Storage Gen2 storage to Power BI Desktop
Open Power BI Desktop, and sign in.
Select Get data > More.
On the Get Data page, select Azure > Azure Data Lake Storage Gen2 > Connect.
Enter the storage container name in the format
https://accountname.dfs.core.windows.net/containername/and replace accountname and containername with your storage account's information.- Find the storage account name by going to Azure > Storage accounts, and then select the Data Lake Storage Gen2 account that's populated with the exported Dataverse data.
- Find the container name by going to Storage Explorer (preview) > Containers and select the name of the container with the exported Dataverse data.

Select CDM Folder View (Beta), and then select OK.
If prompted to sign in, you can sign in with your Microsoft Entra account or with the Account key. To sign in with an Account key, select the option from the left side bar.
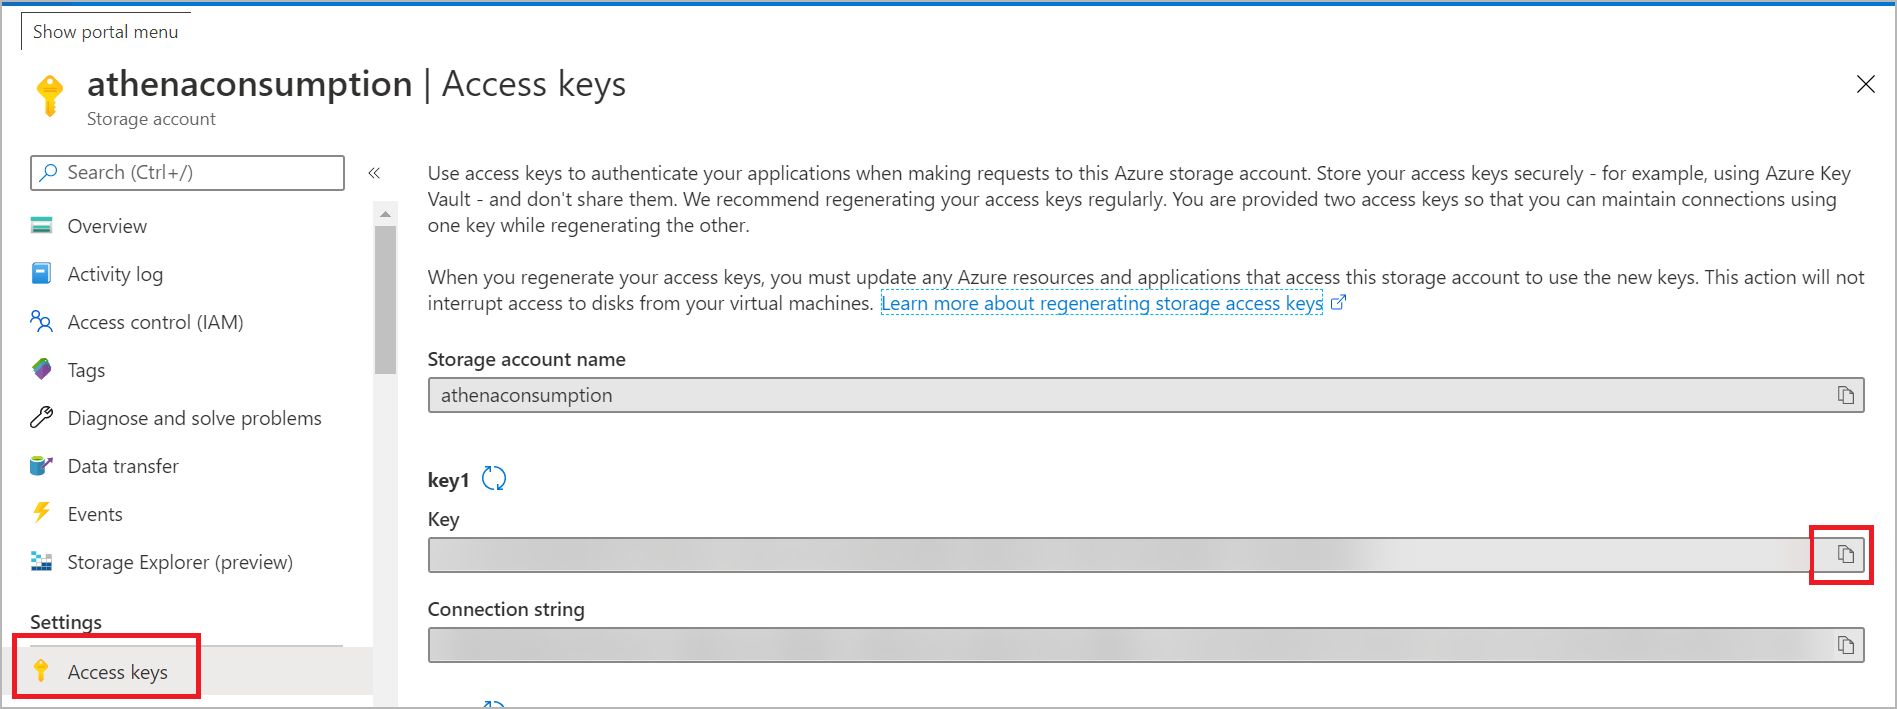
Find the account key by going back to the storage account settings and selecting Access keys from the left pane. Copy the first key and paste it in Power BI. Select OK.

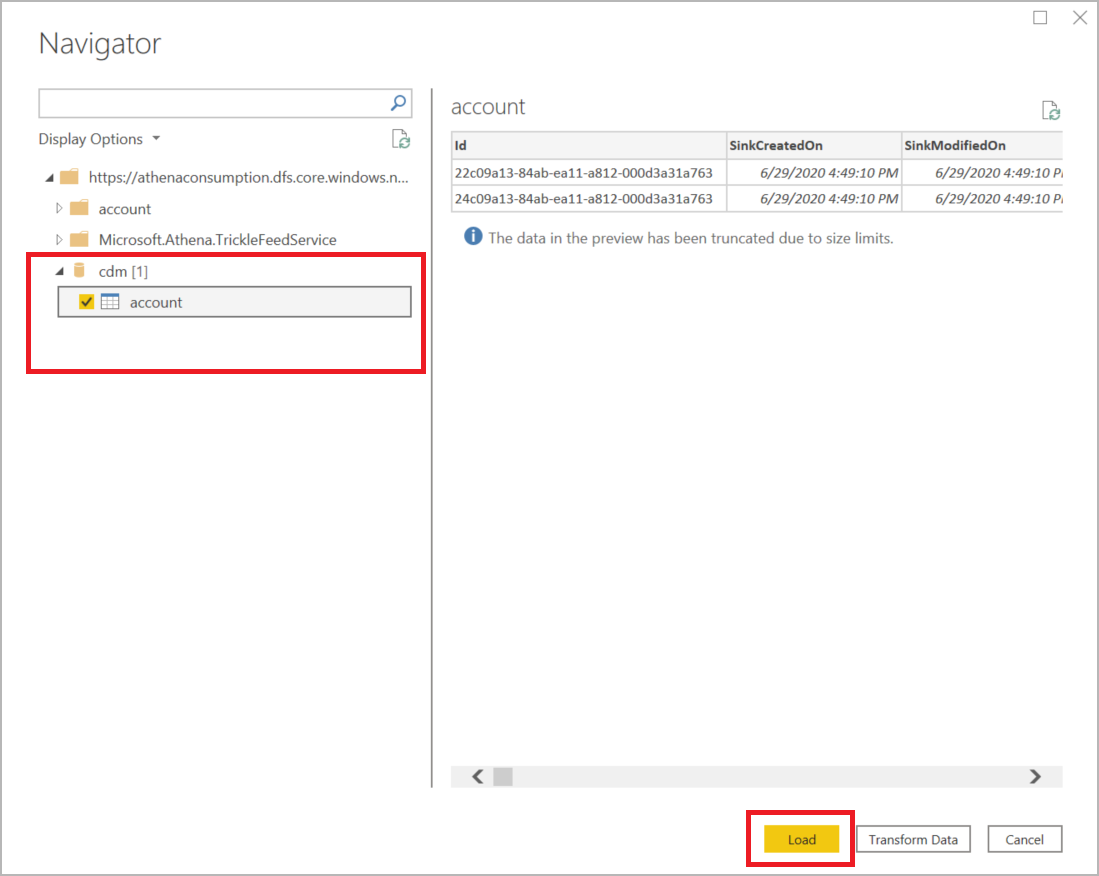
After successfully connecting to your storage account, expand the cdm directory and select the tables that you want to analyze. Then, select Load.

Create a Power BI report with account revenue by account name
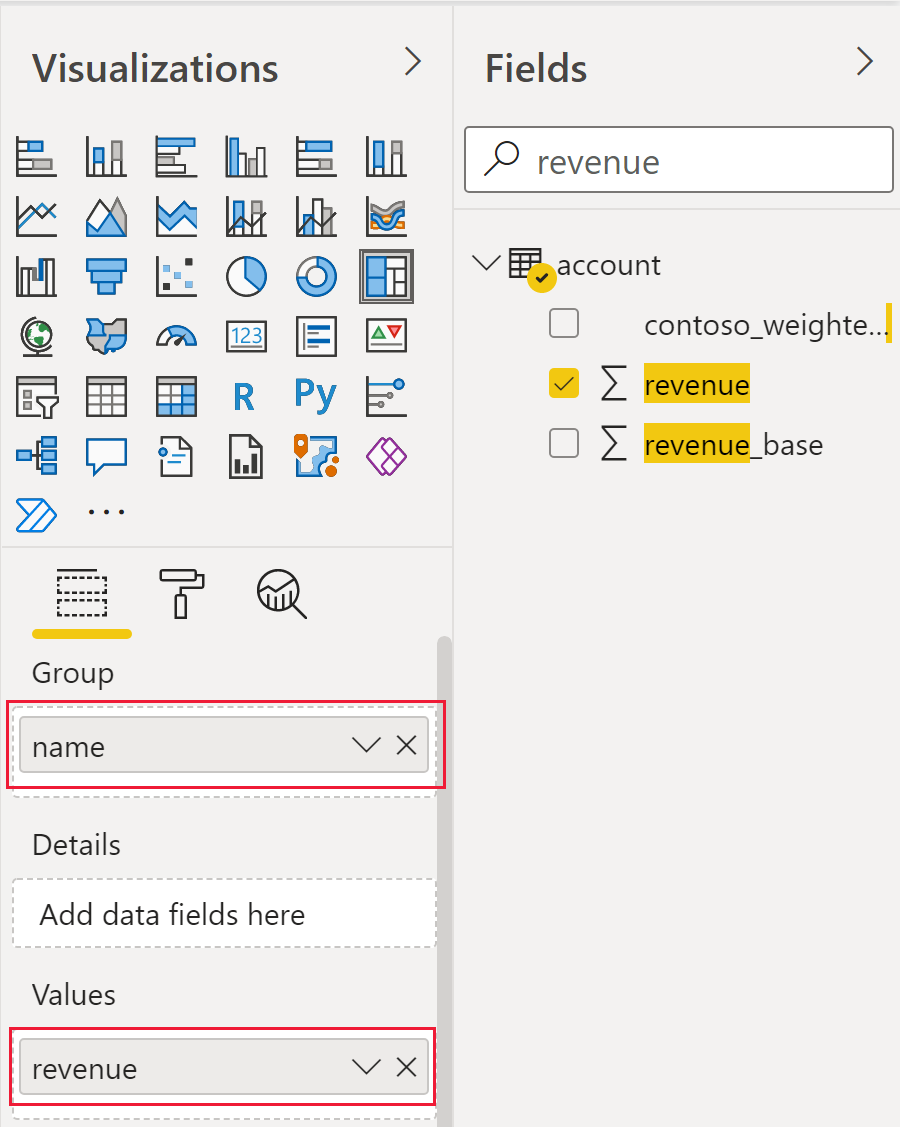
Under the Visualizations menu, select Treemap.

On the Columns menu, search for and select the columns name and revenue. After you select them, the columns will appear on the Visualizations menu for the legend and values, respectively.

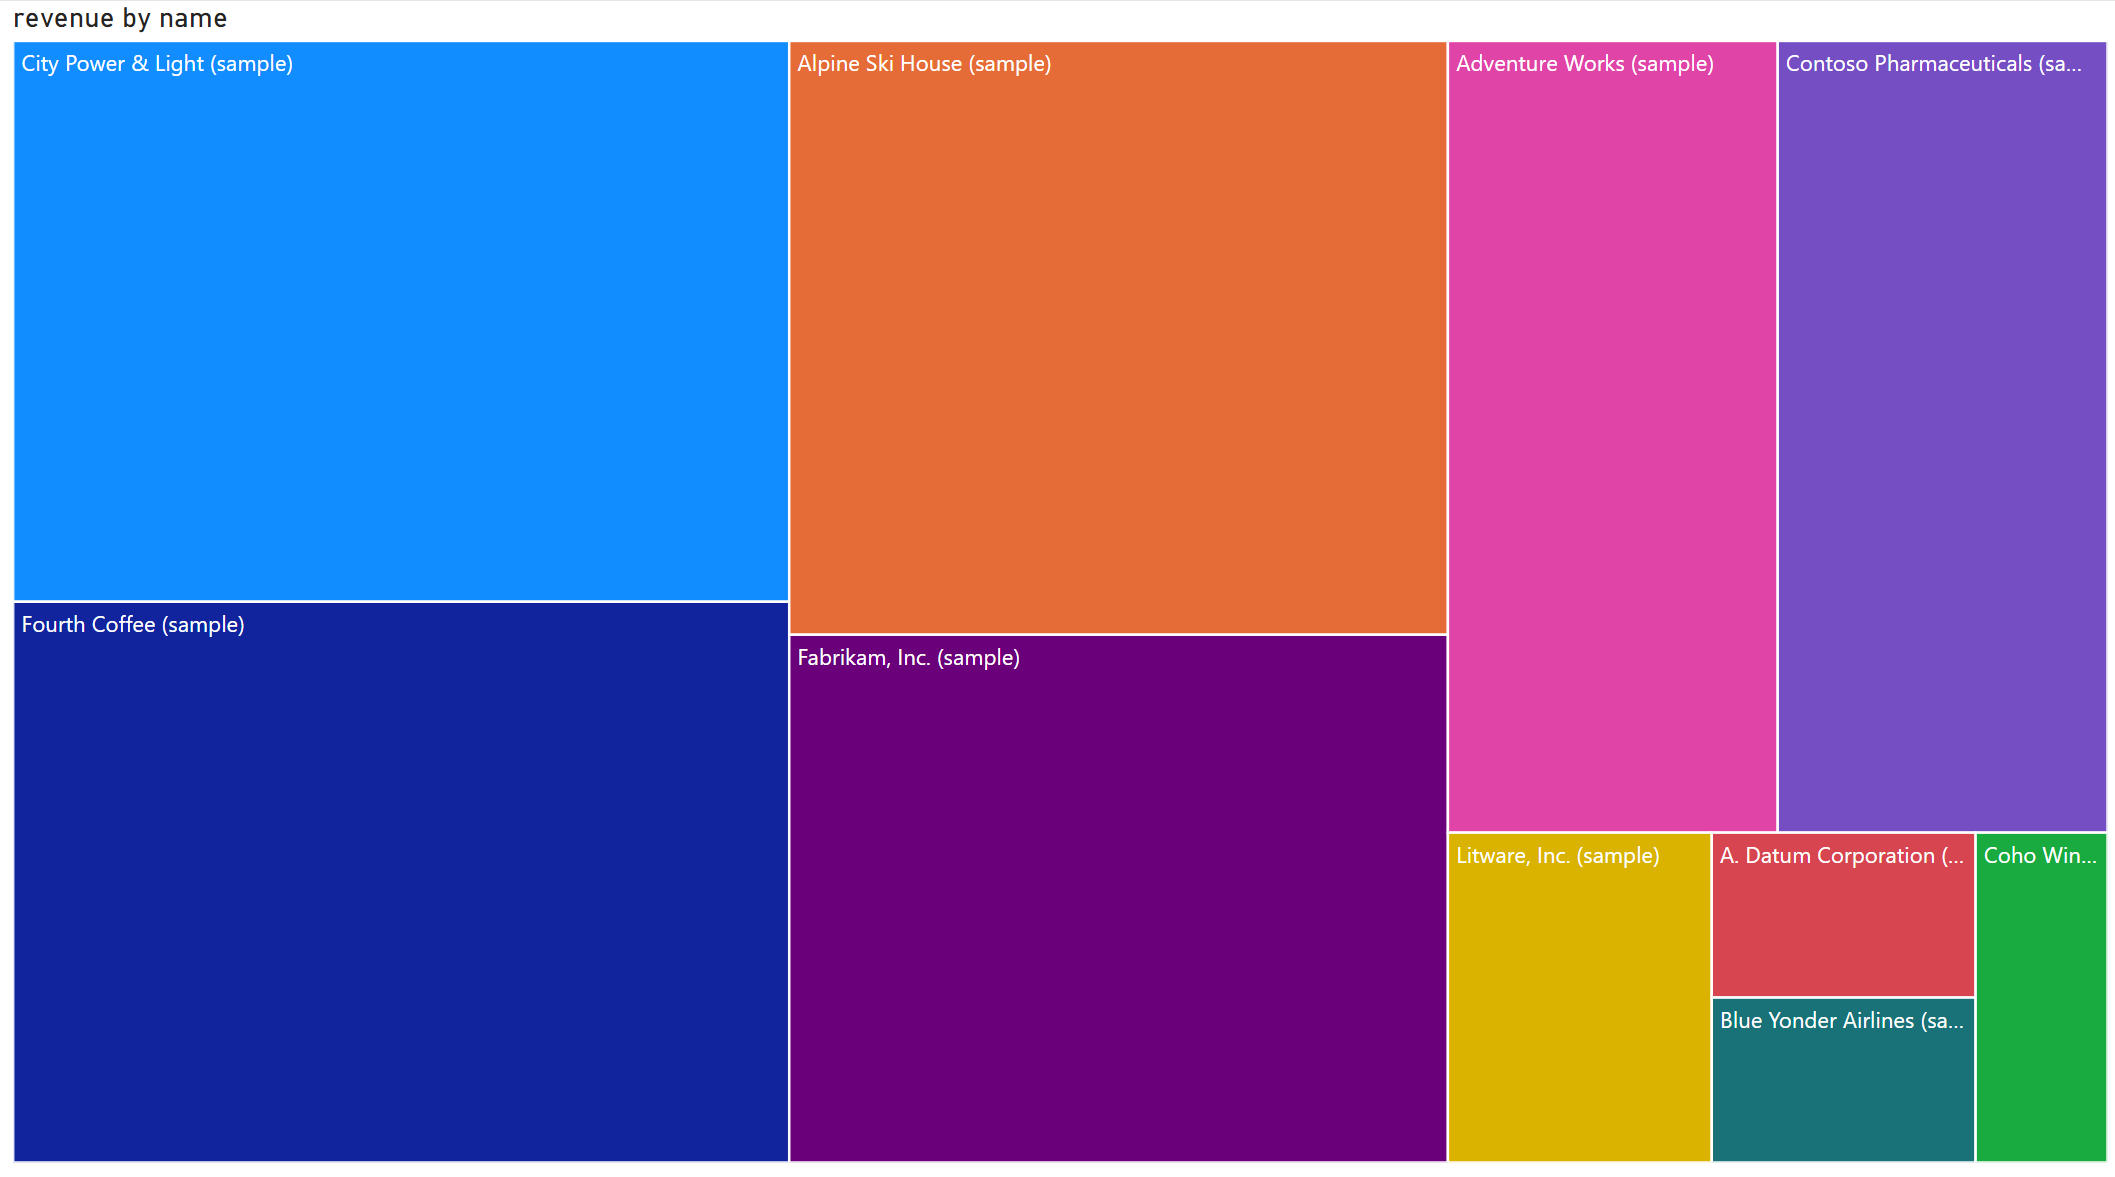
A tree map chart appears that separates each account name by color and indicates the total revenue for each account by size.

See also
Configure Azure Synapse Link for Dataverse with Azure Data Lake
Ingest Dataverse data in Azure Data Lake Storage Gen2 with Azure Data Factory