Note
Access to this page requires authorization. You can try signing in or changing directories.
Access to this page requires authorization. You can try changing directories.
This section describes the different ways you can work with Microsoft Dataverse data in Microsoft Fabric and generate reports in Power BI.
You can view the Azure Synapse Analytics lakehouse, SQL endpoint, and the default dataset generated by Dataverse in the Fabric workspace you chose earlier.
When you select Link to Microsoft Fabric, a Dataverse generated Azure Synapse Analytics lakehouse opens. You can go to other Fabric features and work with Fabric and Power BI.
Explore the Dataverse generated Azure Synapse Analytics lakehouse
The tables you selected are added to the Azure Synapse Analytics lakehouse and displayed in Power BI as shown here. These tables are linked to your Power Platform environment using Dataverse shortcuts. As data changes in Dataverse, the Dataverse shortcuts in Fabric reflect the latest data.
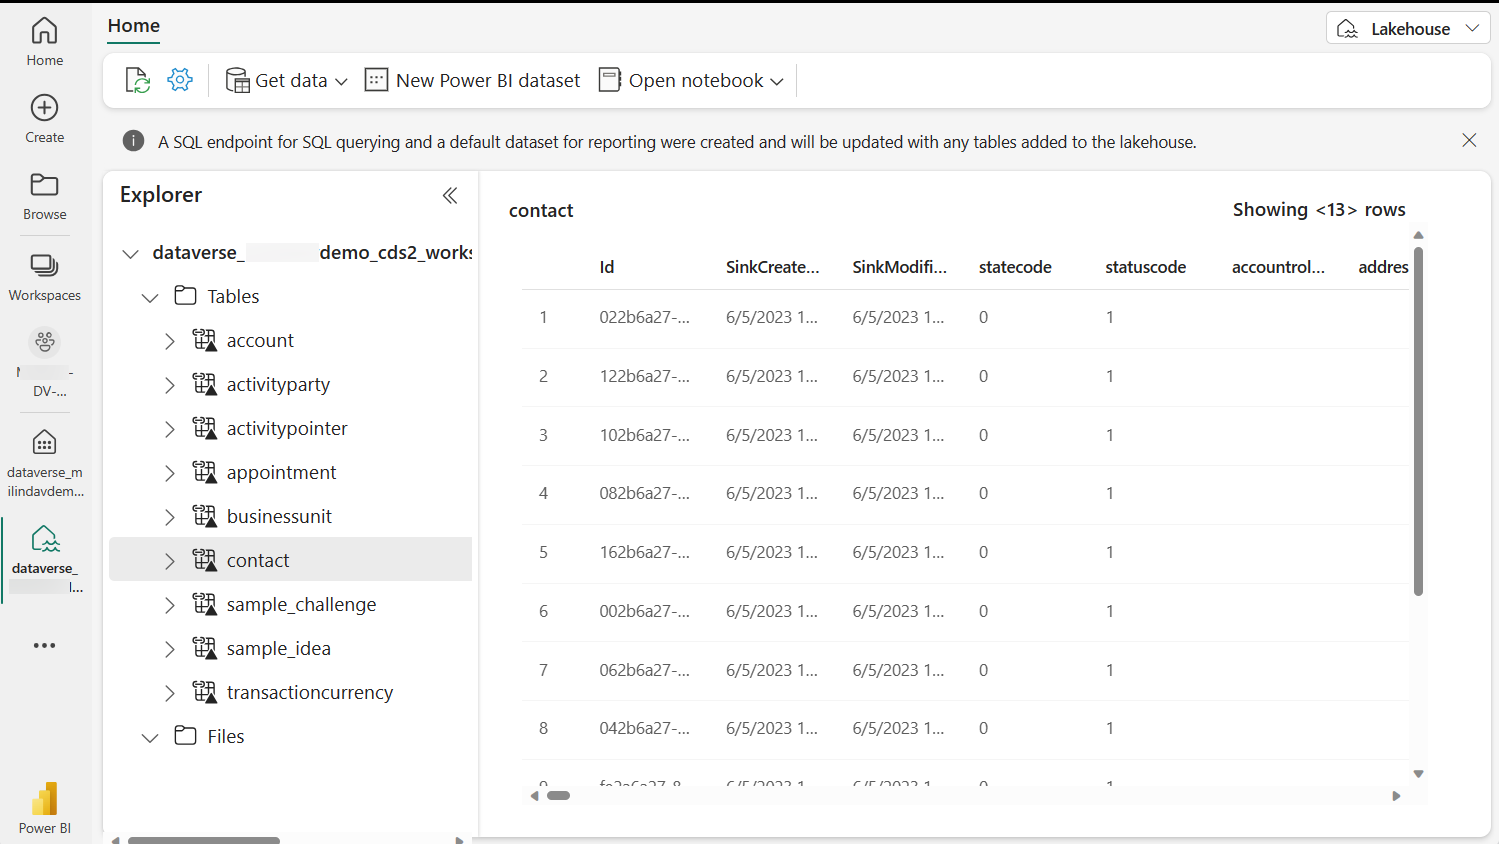
Note that Dataverse manages these shortcuts. You shouldn't delete or remove these shortcuts in Fabric. If you accidentally delete a link, you can go to the Azure Synapse Link for Dataverse area in Power Apps and select Refresh Fabric links to re-create the links.
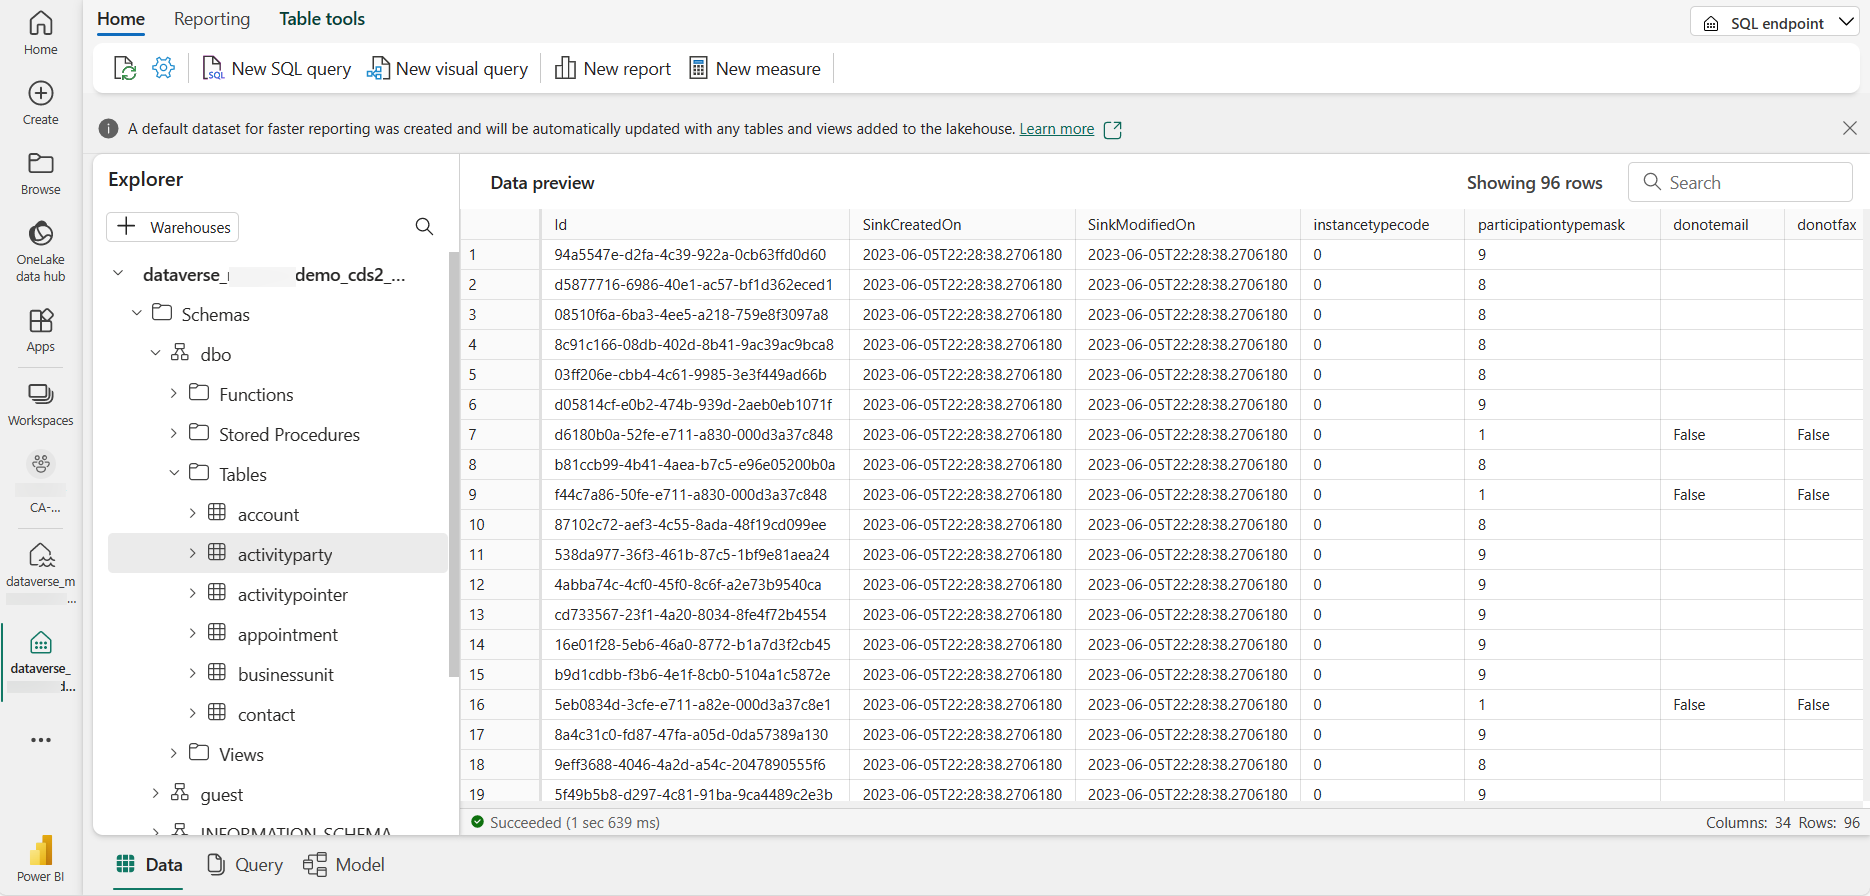
Explore data with SQL endpoint
You can open SQL endpoint and query Dataverse data with SQL and generate views in Fabric.
In Power BI, select SQL endpoint from the top right context menu. The data is displayed in a SQL friendly experience where you can create SQL queries and views.
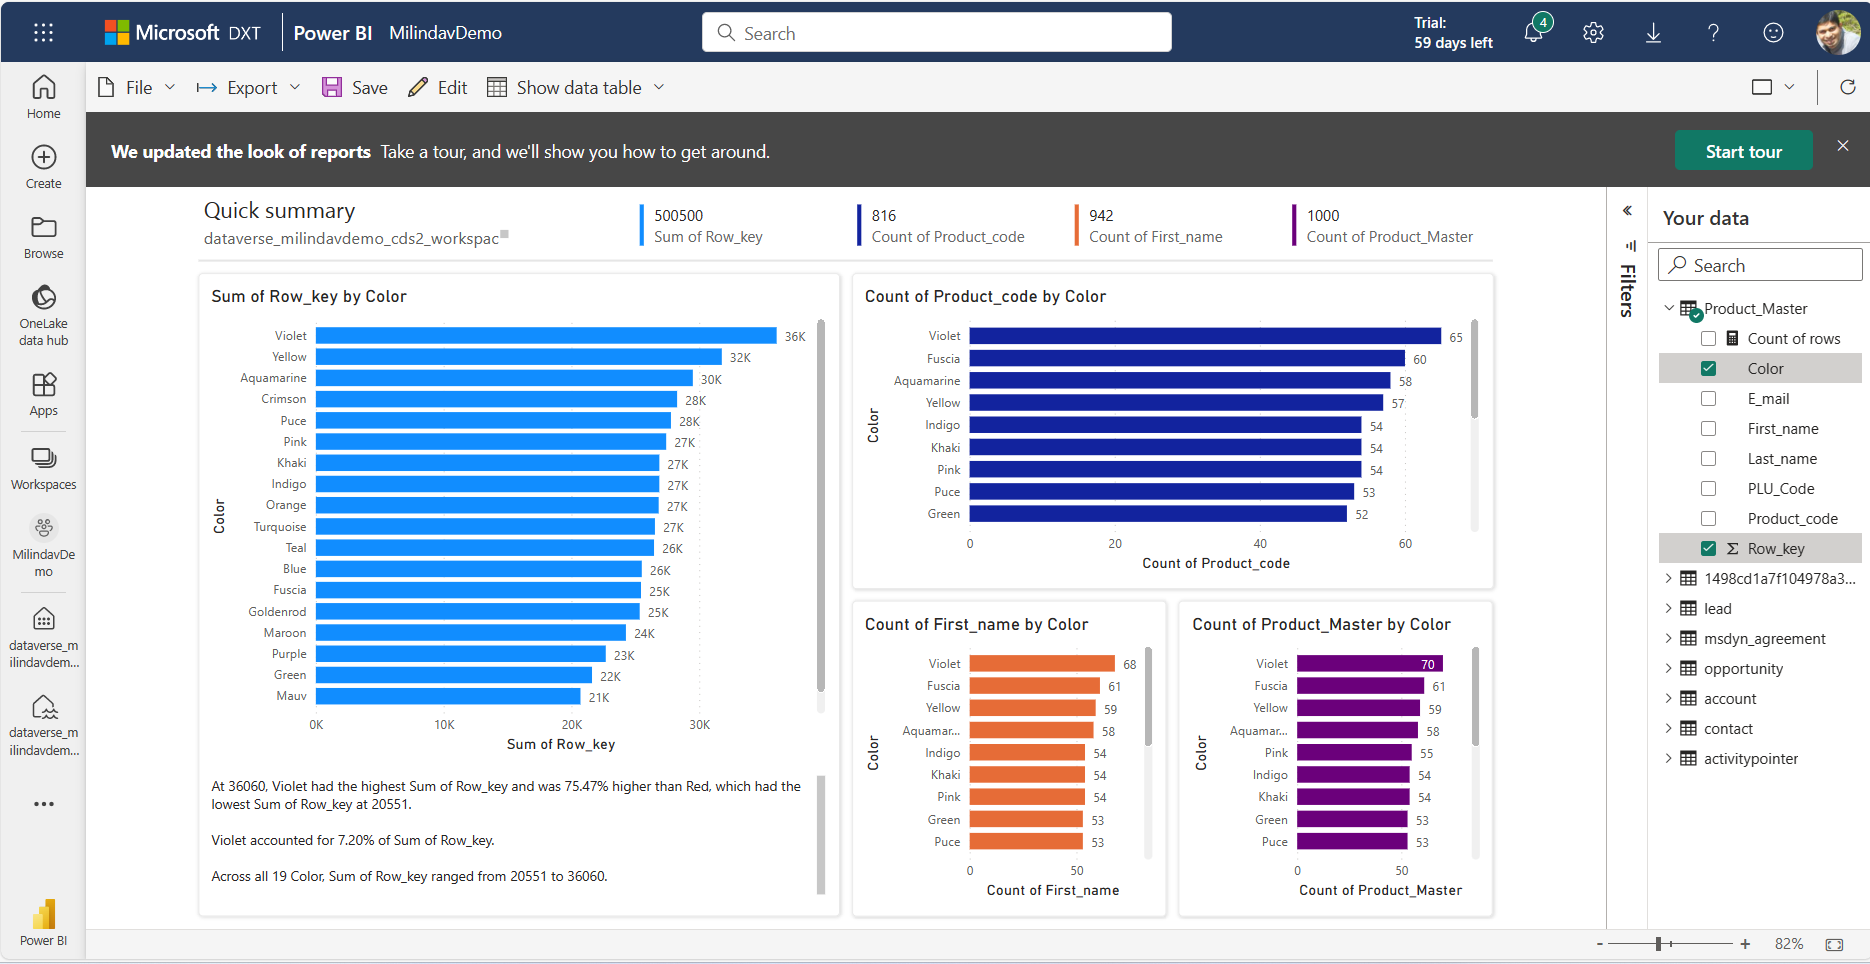
Autocreate a Power BI report
Choose the default dataset generated by Dataverse, and then select Auto-create report. A Power BI report with the data you have selected is created.