Note
Access to this page requires authorization. You can try signing in or changing directories.
Access to this page requires authorization. You can try changing directories.
Power BI is a powerful analysis and visualization tool. Power Apps is great at enabling people to take action via the web and mobile. With Power Apps, a Power BI dashboard can be embedded in an app. Similarly, a Power BI report tile can be added to an app. The best of both worlds can be achieved at the same place and at the same time.
In this article, you create a simple Power BI report and a model-driven app. Then, you learn how to add the report as a dashboard in the app.
Prerequisites
To complete this tutorial, you need the following:
- Ability to create Power BI dashboards and reports in Power BI.
- Enable the Power BI visualization embedding setting for your environment from the Power Platform admin center. More information: Manage feature settings
Create a workspace, dashboard, and report
If you don't already have a workspace with a Power BI report, follow these steps to create one. If you already have a workspace, go to Add the dashboard and report to a solution.
Download the Excel financial sample Excel workbook.
Sign in to Power BI with the same Microsoft Office subscription as the one you use for creating apps in Power Apps.
Select Workspaces on the left navigation pane, and then select New workspace.
Enter a name for the workspace, such as Contoso Power BI workspace, and then select Apply.
Select New item, select Dashboard, enter a Name, and then select Create.
Select Workspaces on the left navigation pane and select the workspace you created. Select New item > Report.
Select Excel, select Upload file, select Browse, locate and select the Financial Sample.xlsx file you downloaded previously, and then select Open.
When the file is uploaded, select Sign in, and then select Next.
Select the financials tab, and then select Create.
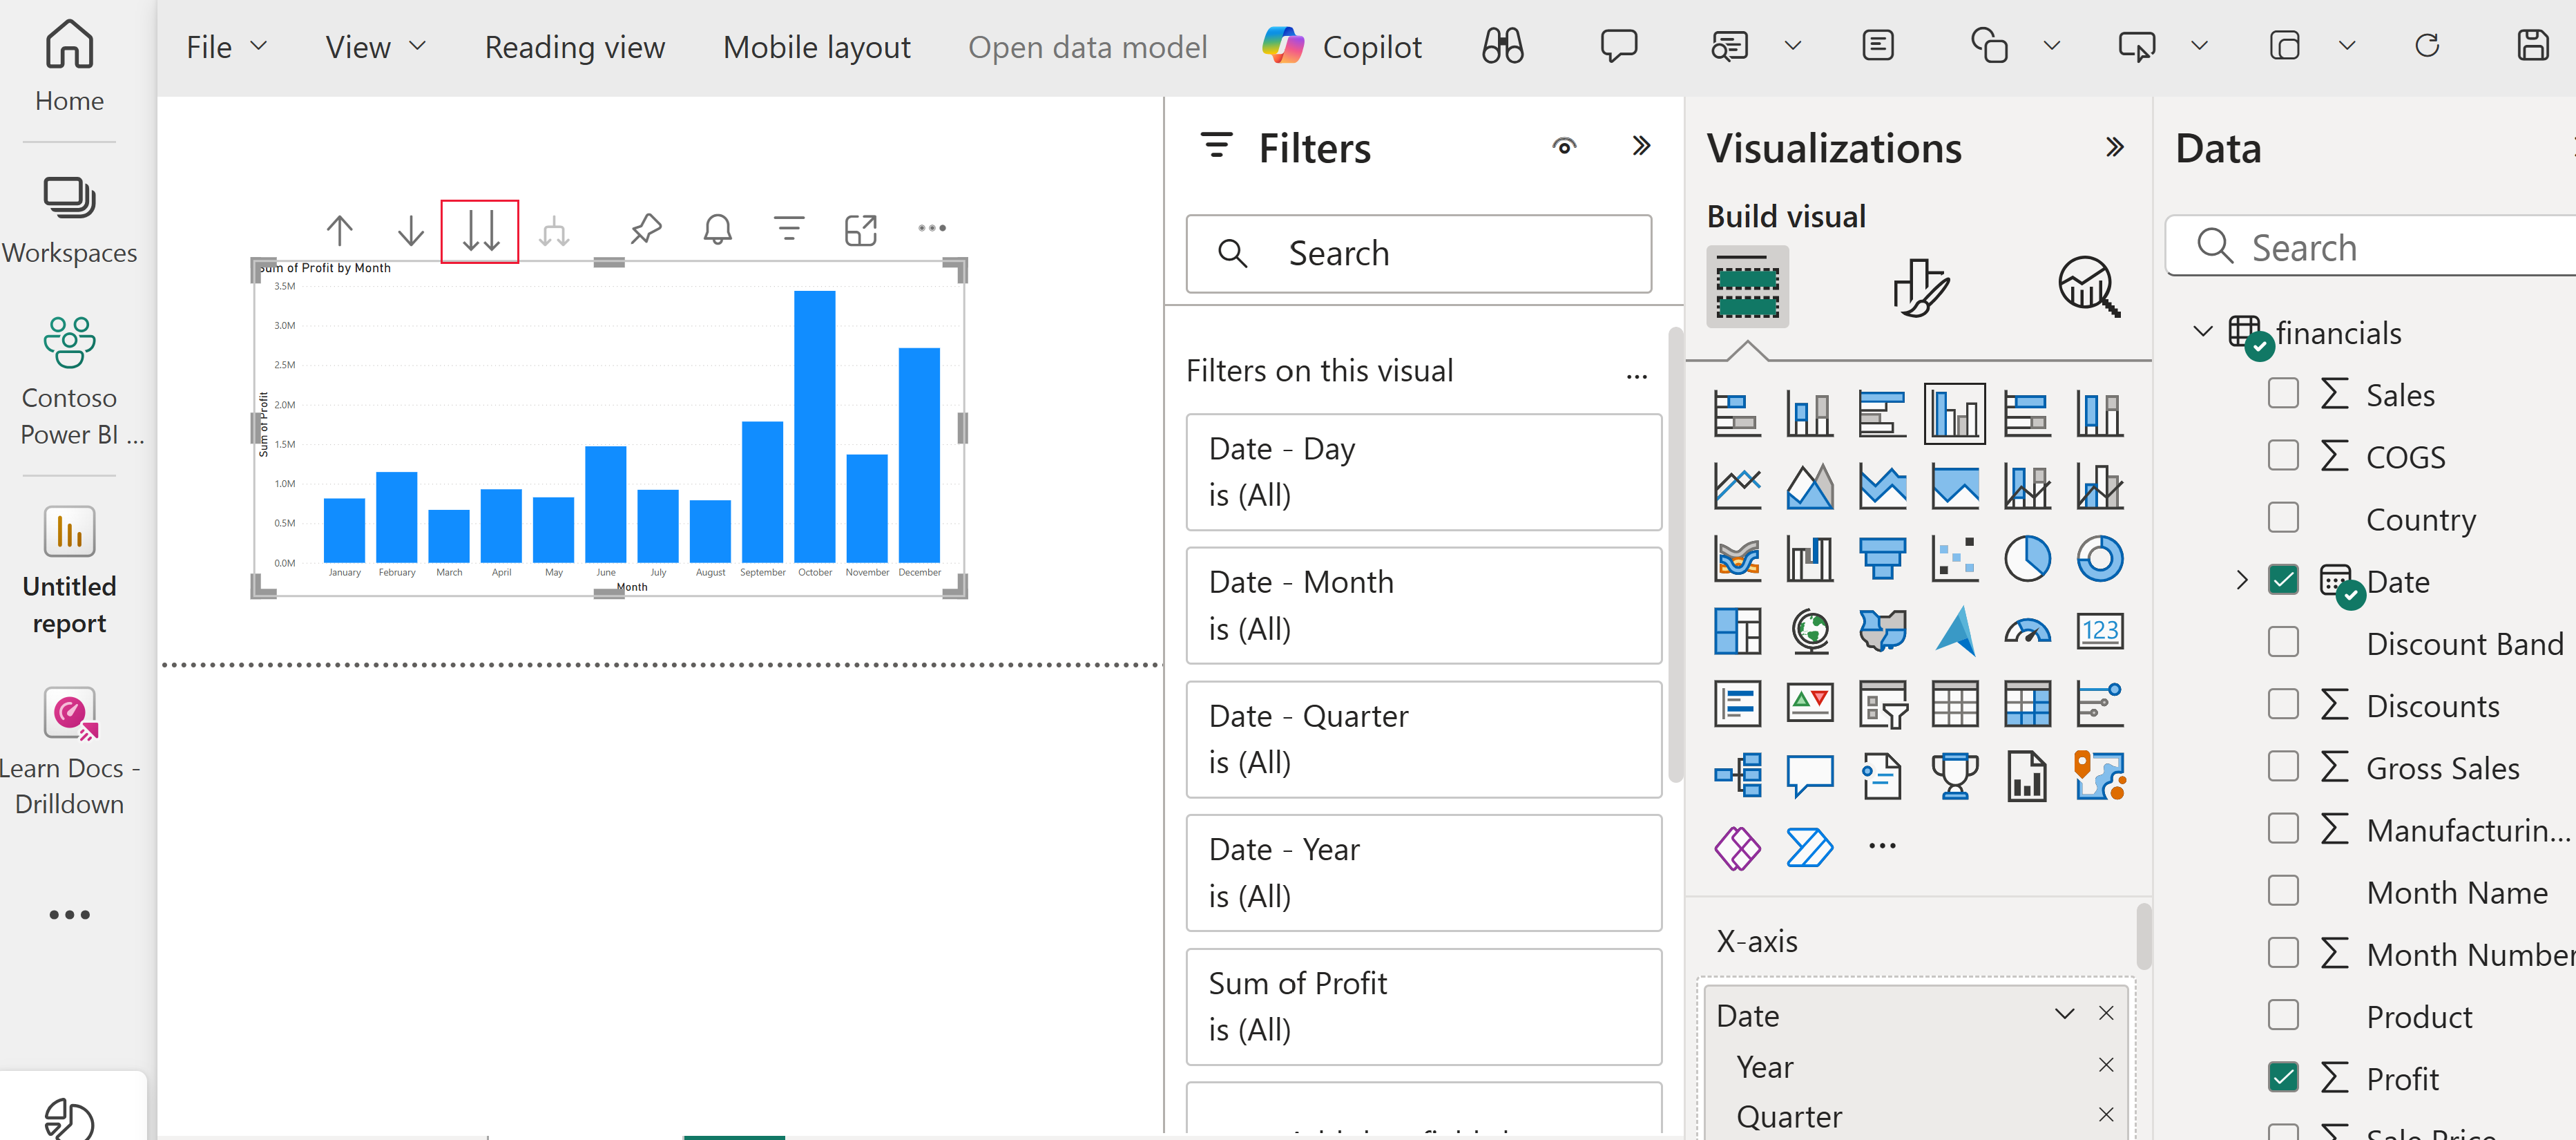
Now, build a visual:
- Expand financials in the right-hand Data pane, and drag Profit to the report canvas.
- Drag Date and drop it on top of the Profit chart.
- Drag an edge of the chart to resize it.
- Select the chart and then select the forked double arrows to show quarters, and then select them again to show months.
Save your report as Financial Samples.

Add the dashboard and report to a solution
In this section, you create a solution in Power Apps that includes a Power BI embedded dashboard object.
Sign in to Power Apps. On the left navigation pane, select Solutions. If the item isn’t in the side panel pane, select …More and then select the item you want.
Create a new solution or open an existing unmanaged solution.
Open the solution and select New > Dashboard > Power BI Embedded.
In the right properties pane, enter or select the following properties:
- Display name: Test Embedded BI Report
- Type: Power BI report
- Clear the Show reports in this environment only option.
- Power BI workspace: Locate and select the workspace you created earlier, such as Contoso Power BI workspace.
- Power BI Report: Locate and select the Financial Sample report you created for the workspace.
Select Save.
Select Publish on the command bar.
Create a model-driven app and add the Power BI report
In this section, you create a model-driven app and add the Power BI embedded report you created earlier.
Sign in to Power Apps, select the environment you want, and then on the left navigation pane, select Solutions.
Open the solution you created to add the embedded Power BI dashboard.
On the command bar, select New > App > Model-driven app.
Enter a Name, such as Model-driven app with Power BI dashboard, and then select Create.
In the app designer on the command bar select Add page, select Dashboard, and then in the dashboard picker select Power BI dashboards.

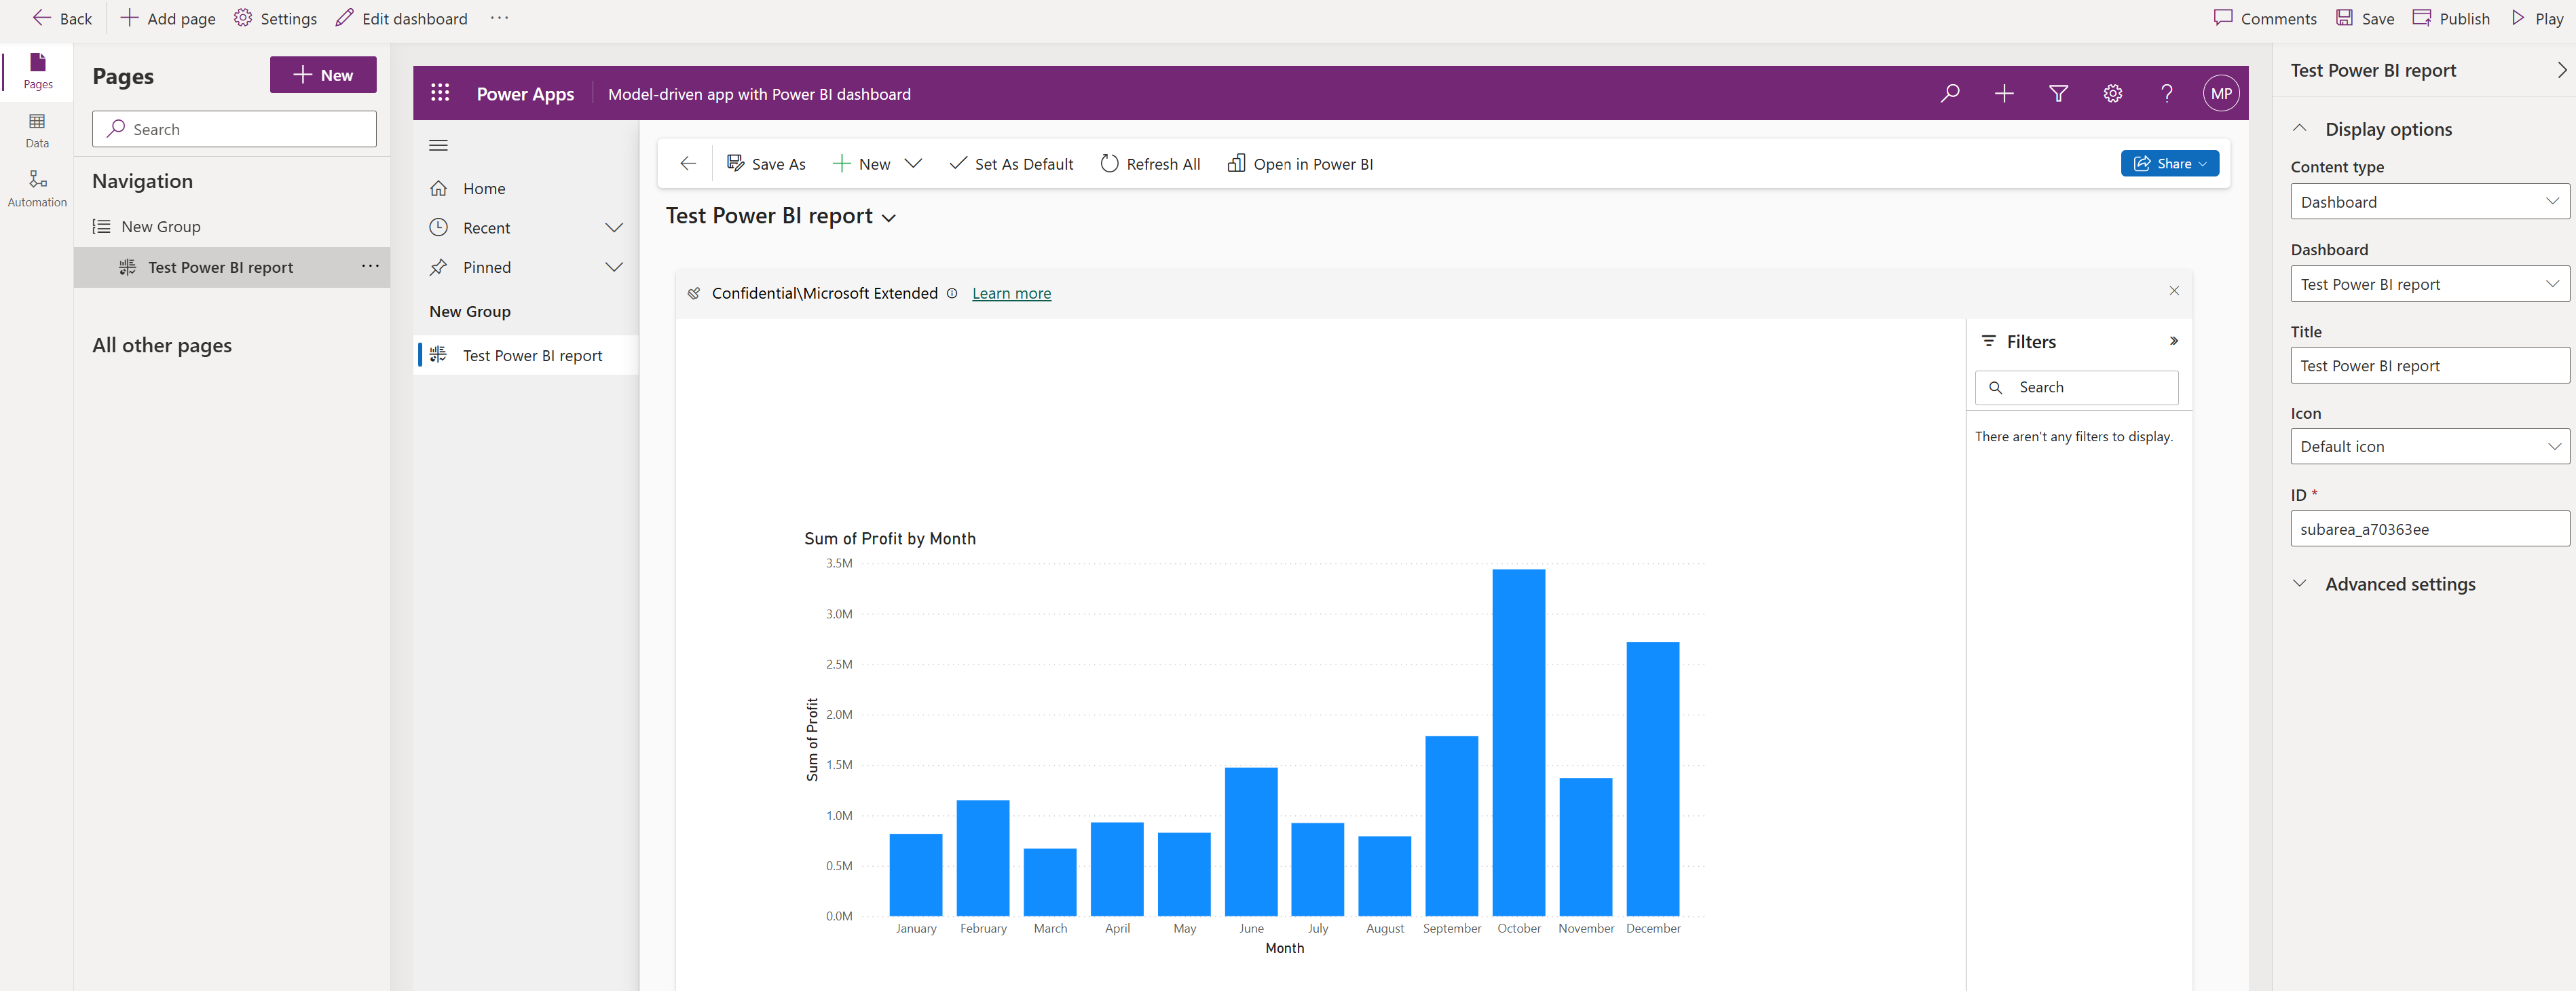
Select the Test Power BI report you created earlier, and then select Add.
The report loads in the app designer similar to how it appears to your users when they play the app.
Select Save and publish to save and publish you app making it available for users.
