Note
Access to this page requires authorization. You can try signing in or changing directories.
Access to this page requires authorization. You can try changing directories.
As you scale the automation of your business processes, you may need access to aggregated data to monitor your desktop flows effectively. The Desktop flow activity section of the Power Automate portal (Monitor > Desktop flow activity) provides dashboards, tables, and graphs to monitor desktop flows, measure effectiveness, and quickly identify issues.
You can filter the presented data by date, desktop flow, cloud flow, machine, run mode, run status, and error. Filtering enables you to focus on a specific range of data and handle it more efficiently.
Note
- Some filters may not be available for some pivots because of the nature of the presented data.
- When you move between pivots, the tab keeps the active filtering selection. Select Clear filters to reset the applied filters.
Available data for admins and makers
The Desktop flow activity section is helpful for Center of Excellence (CoE) users who want to monitor all activity in an environment and makers who want to get an aggregated view of their automation. Learn more about the CoE in Microsoft Power Platform Center of Excellence Starter Kit.
If you're the admin of the current environment, you can see all the desktop flows, machines, and machine groups that exist in Dataverse for the environment. If you're a maker, you can see all your desktop flows and machines, including the flows that others share with you.
Note
If a cloud flow appears as private flow, it means that it isn't shared with you. Cloud flows aren't saved in Dataverse, and environment admins need to get access to the flows to read details about them.
Last runs: Monitor desktop flow runs
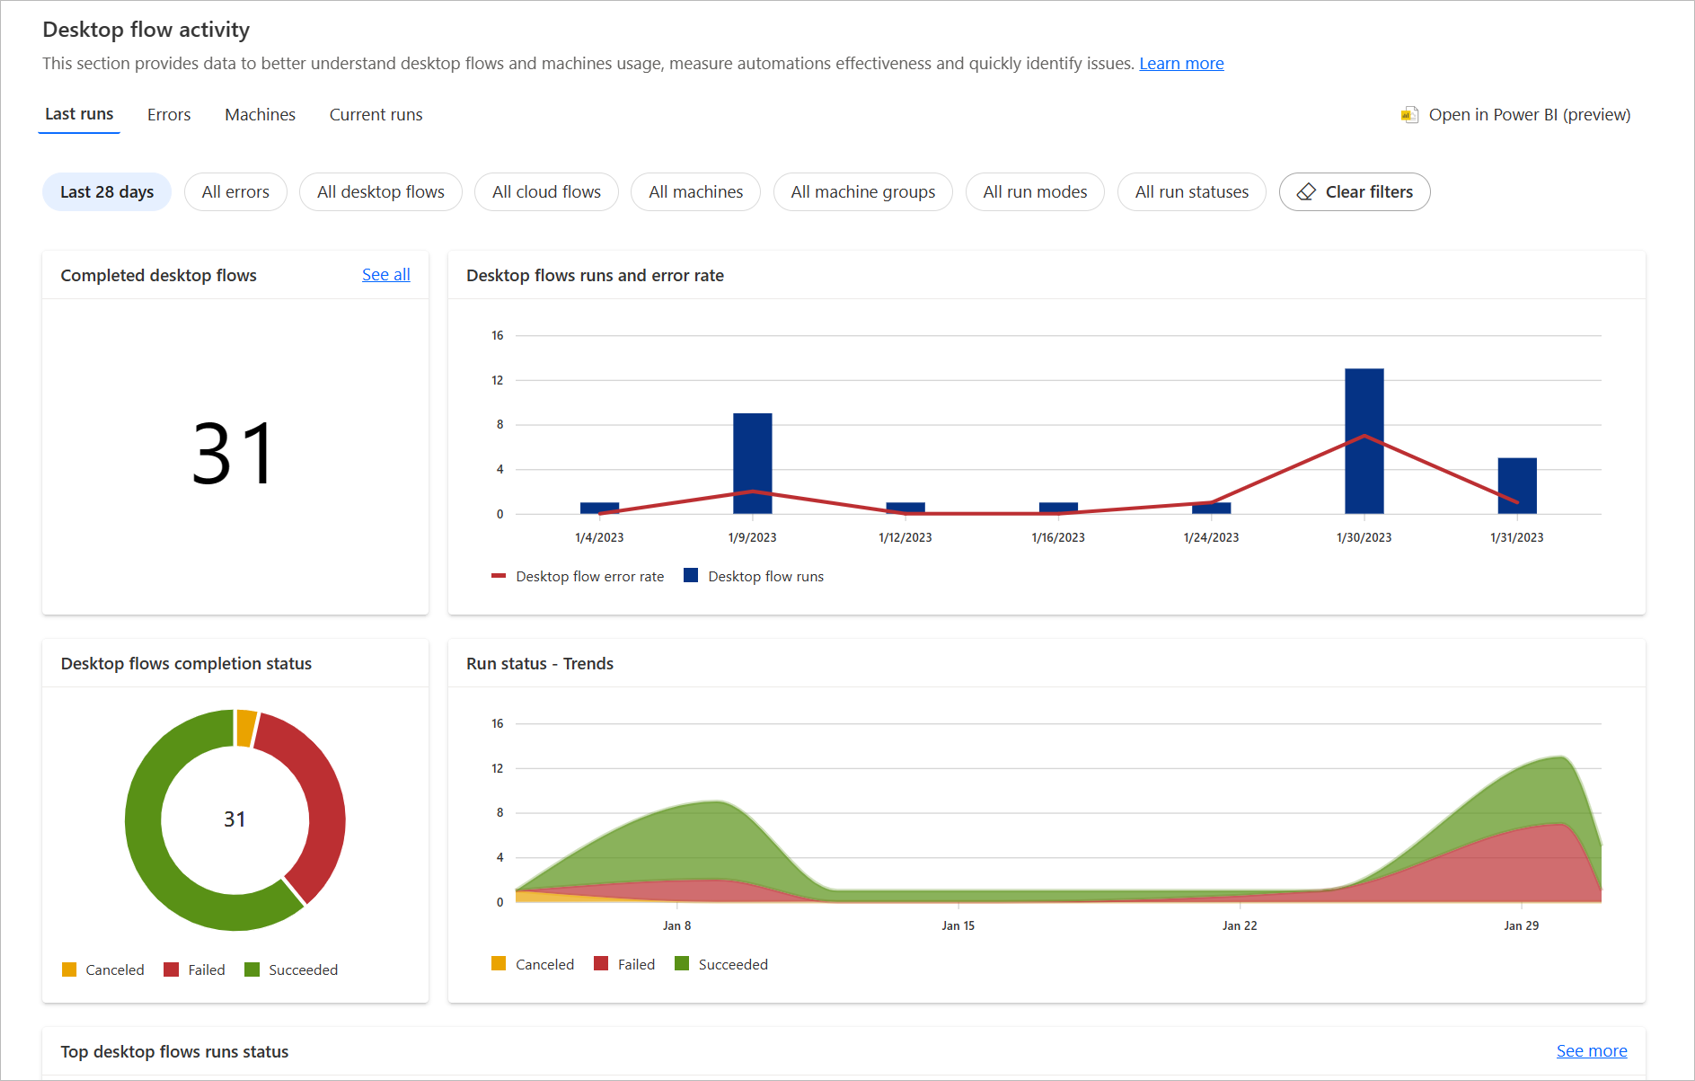
The Last runs section provides graphs and tables to get meaningful insights about your desktop flow runs, such as the number of runs, the percentage of errors, and the run modes.
You can find information regarding each table in the following list:
Completed desktop flows: This card provides the number of desktop flow runs in a selected period of time.
Desktop flows runs and error rate: This chart shows the number of desktop flow runs and the error percentage by date. If no desktop flows run for one or several days, the corresponding data aren't available in the table.
Desktop flows completion status: This donut chart displays the proportion of desktop flows that succeeded, failed, or got canceled.
Run status – Trends: This stacked area chart helps you understand how your flows work across time. Use this chart to quickly identify if there was a particular issue during a dedicated time period, such as too many failures and low number of runs.
Top desktop flows runs status: This card presents the desktop flows that ran the most during a dedicated time period. For each presented desktop flow, the card gives details about the run mode (attended, unattended or local) and the run status (successful, skipped, failed, canceled). If you want to review specific desktop flows, select them in the appropriate filter.
Last desktop flows runs: This card displays the latest completed desktop flows runs.
Errors: Monitor desktop flow errors
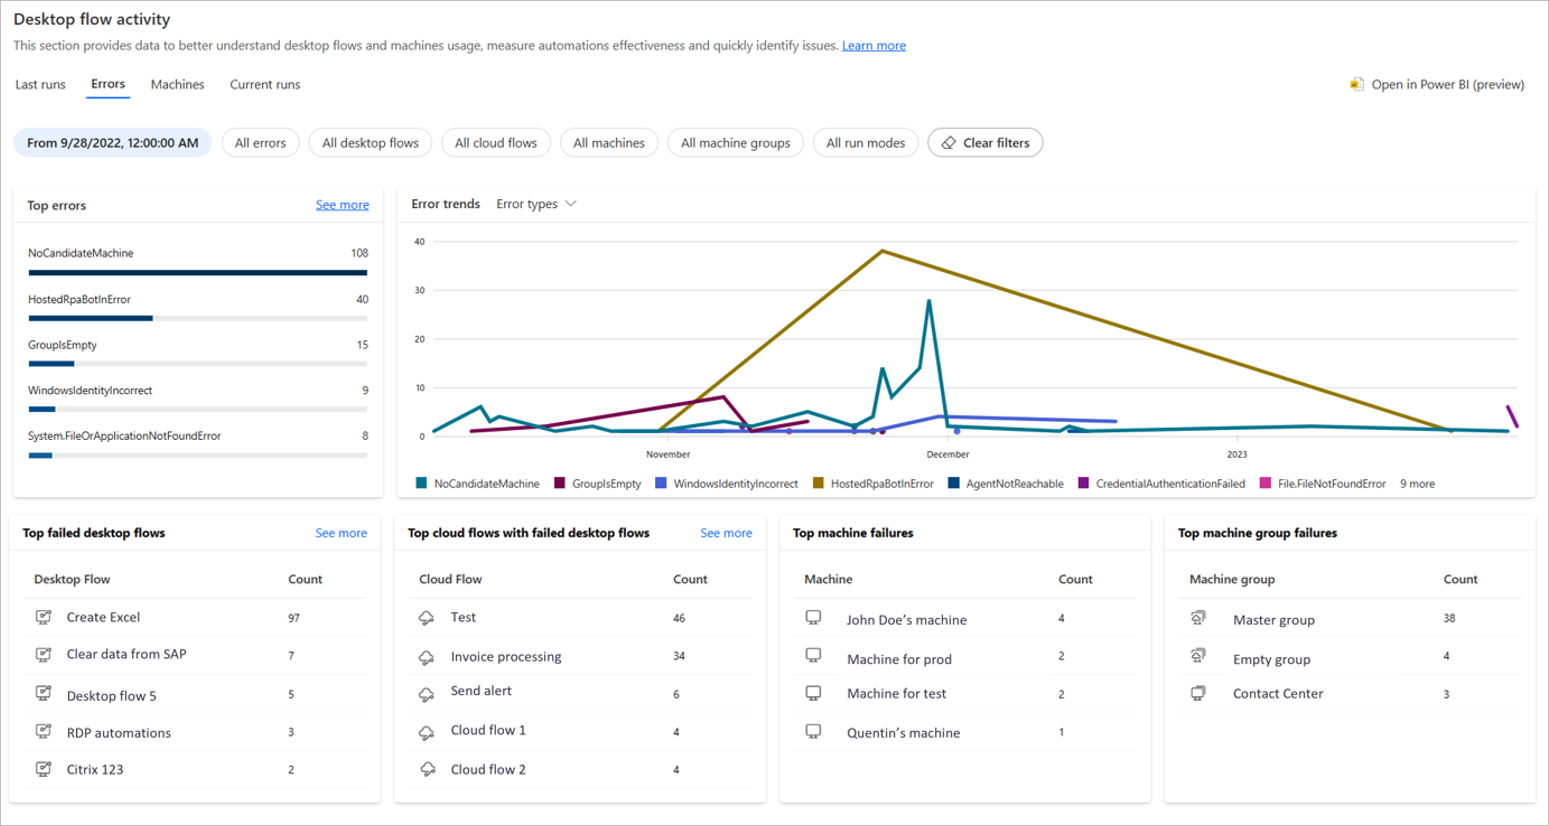
You can use the Errors section to identify the most common errors that occur while your flows run. These pivot tables provide information about desktop flows, cloud flows, and machines in which errors occurred, allowing you to view details to identify the source of errors.
By default, this section displays the desktop flow run errors for the last seven days. Optionally, you can select another time period and filter on specific errors.
You can find information regarding each table in the following list:
Top errors: This card displays the errors that occur most frequently during your desktop flow runs. If you can't see a specific error in the card, select the All errors filter, and then choose the error that you want to see.
Top failed desktop flows: This card displays the desktop flows that failed the most in your environment. You can select each desktop flow to display its details page.
Top cloud flows with failed desktop flows: This card provides a list of cloud flows that are the most impacted by failures in desktop flows. For example, if a cloud flow contains two desktop flows and these desktop flows failed two times each, you'll see this cloud flows with a count of four errors.
Top machine failures: This card displays information about the machines on which desktop flow runs failed most frequently. You can select each machine name to display its details page.
Error trends: This chart displays daily trends for errors in desktop flow runs. These trends can help you to identify if an error started to appear recently or several days ago. In addition to trends per error, the chart can display trends per desktop flow and machine. Select the dropdown menu of the table to display the type of pivot you prefer.
Machines: Monitor your machines and machine groups
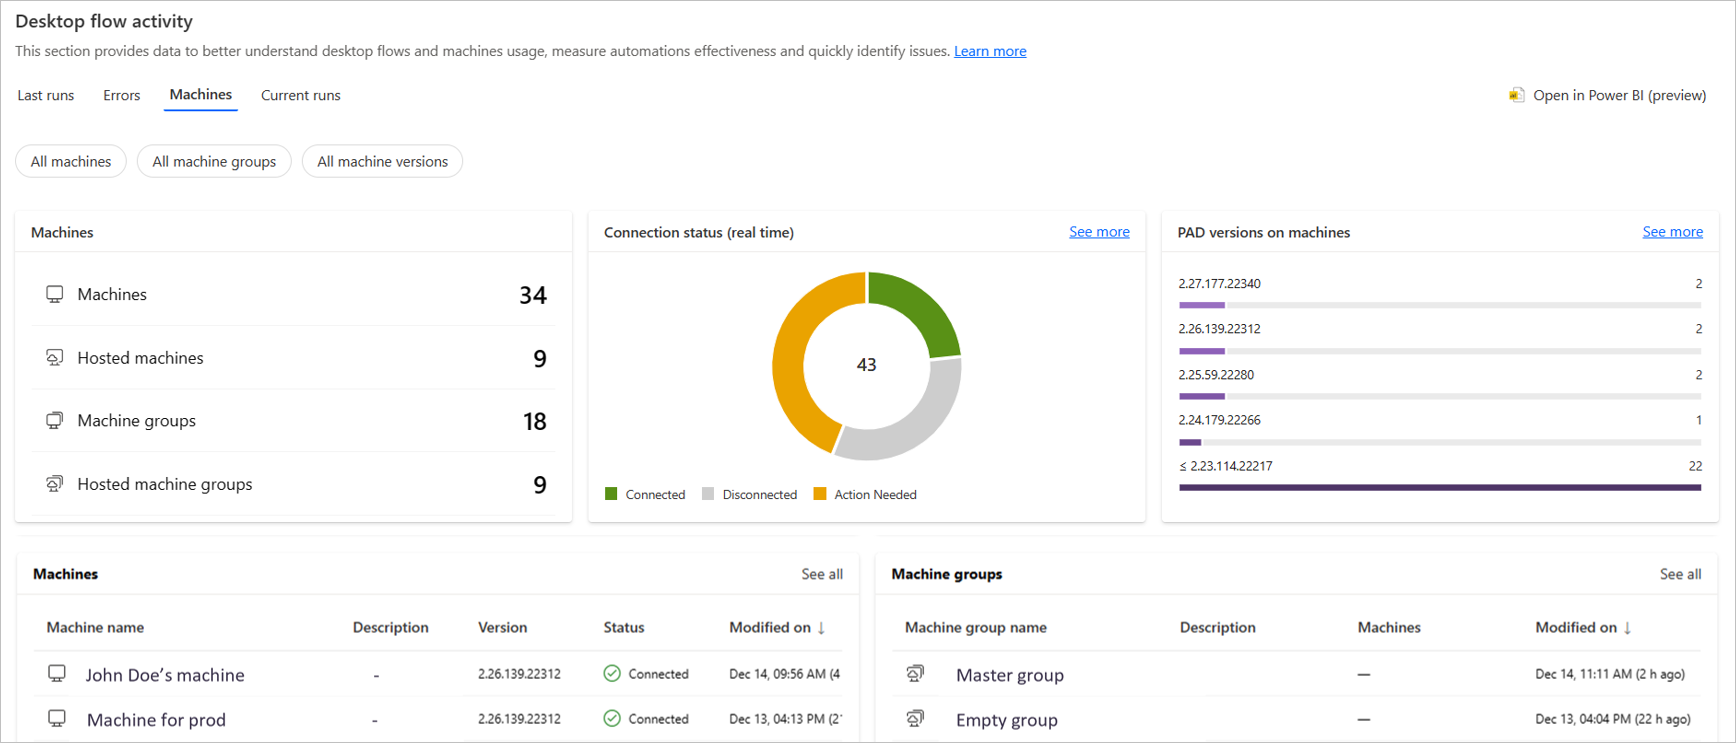
You can use the Machines section to monitor your machines and machine groups. These pivot tables provide information about the number of machines, groups, connection status, Power Automate for desktop versions installed on machines, and lists of machines and machine groups.
- Connection status: This card displays the connection status of your machines (connected, disconnected, action needed). If you want to see machines that are disconnected, select See more. In the pane, you can see all the machines per connection status. You can select the machine name to reach its details page.
Note
There is a limit of 40 connection statuses displayed at one time. If you have more machines in your environment, use the filters to reduce the current selection.
Versions on machines: This card displays for each version of Power Automate for desktop, the number of machines that use this version. This feature is useful to understand which machines require updates (you should update your application regularly). From filters, you can select a dedicated version and see machines that are using this version.
Machines and Machine groups: These cards display the 10 last modified machines and machine groups (name, description, version, status). Select See all to view the full list of items, if you have more than 10 machines or groups.
Current runs: Monitor your queued and running desktop flows
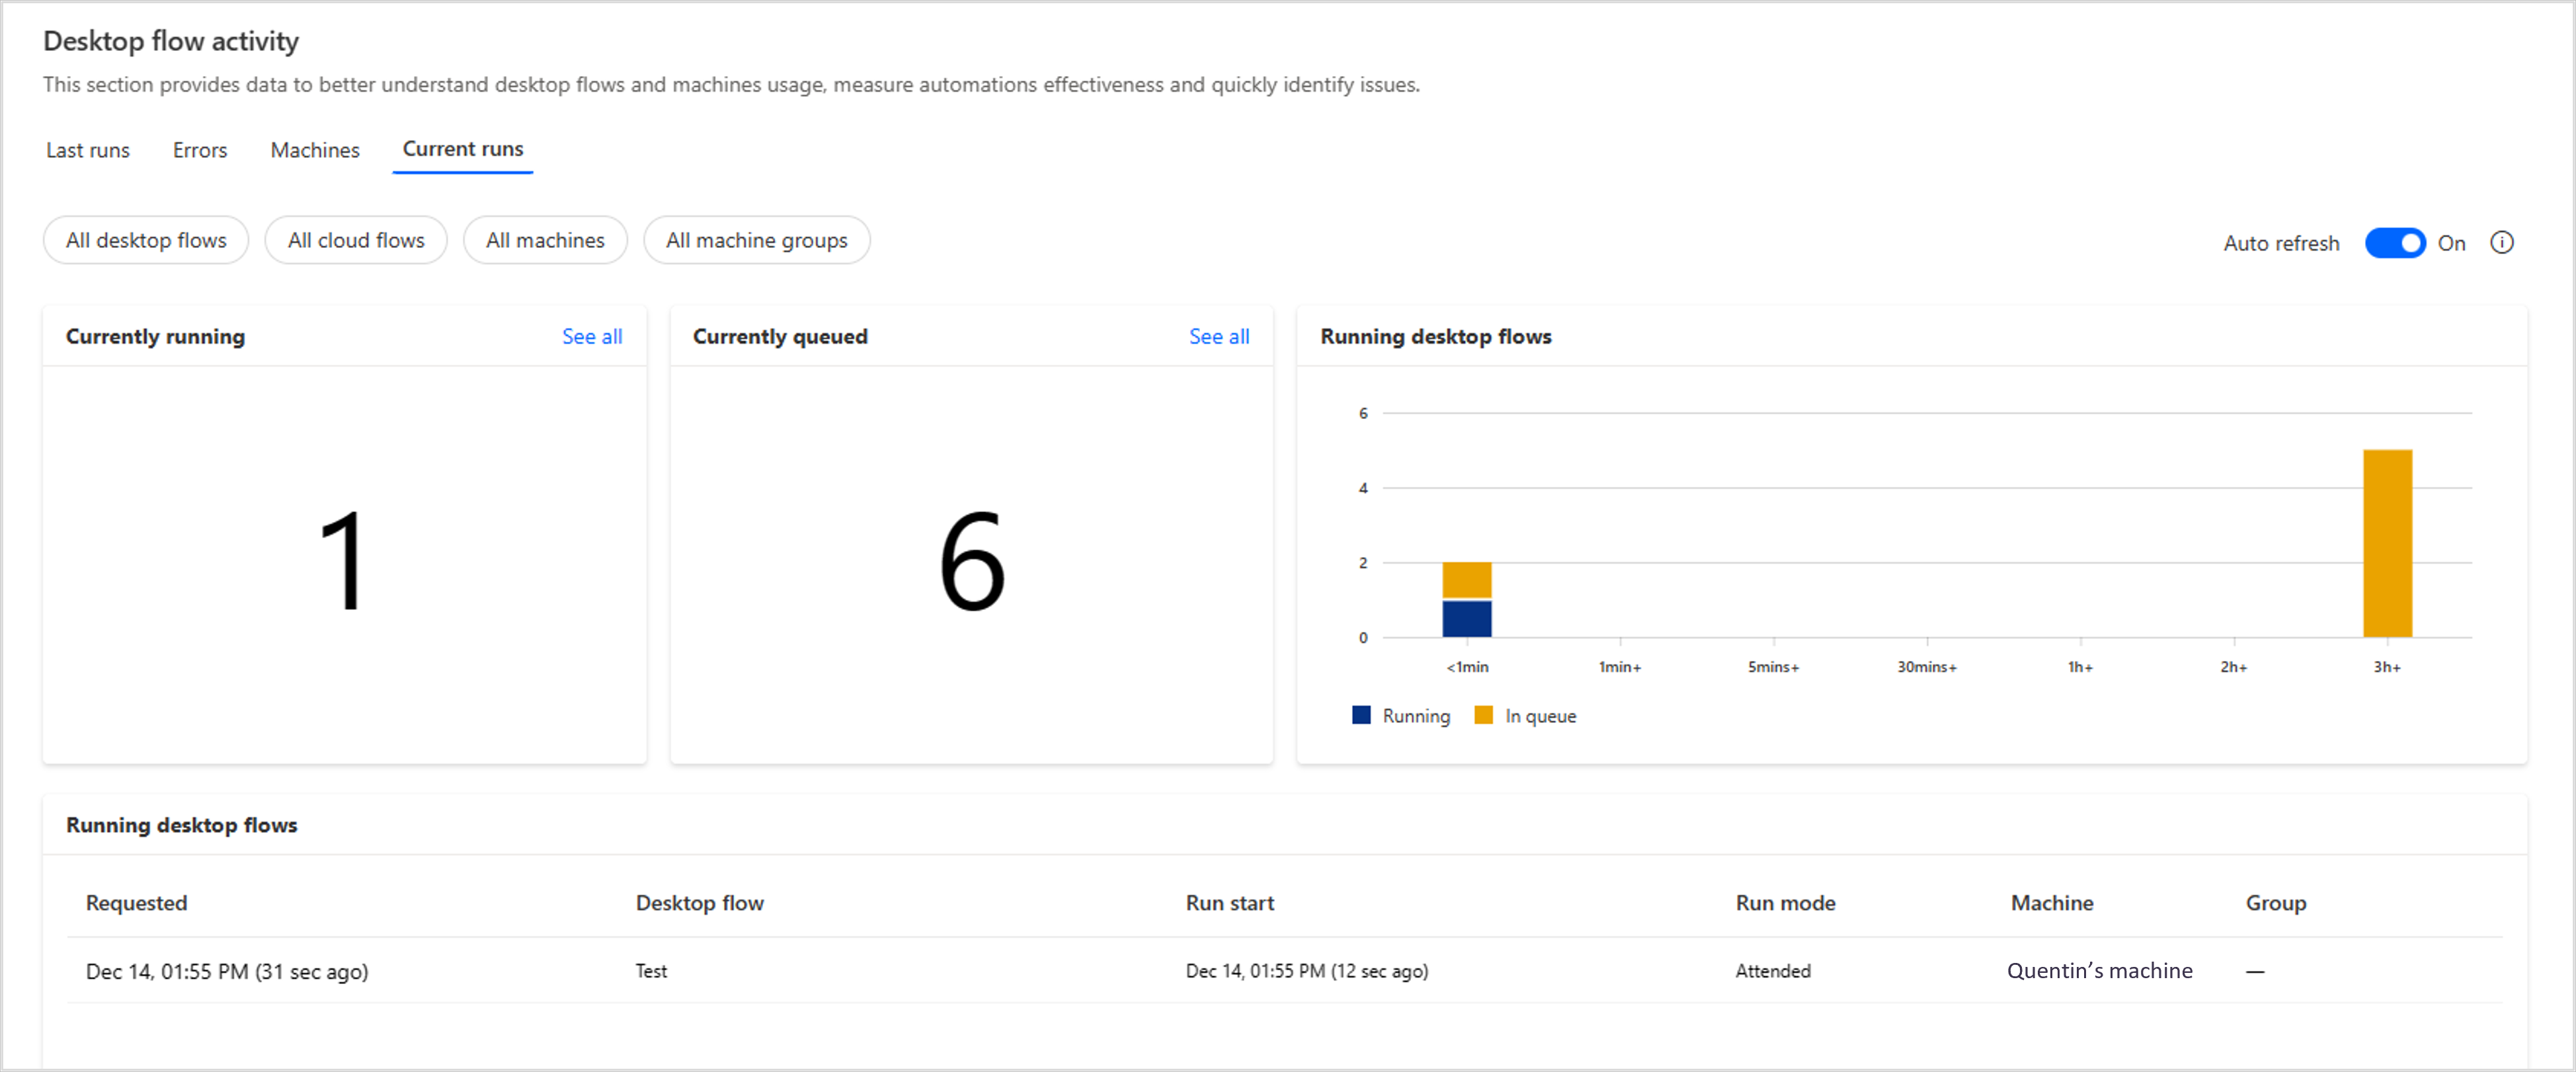
You can use the Current runs section to monitor active desktop flow runs. These pivot tables provide information about the number of running and queued desktop flows, and lists with the running and queued desktop flows.
By selecting Auto refresh, all the cards will be refreshed automatically.
Currently running and Currently queued: These cards display the total number of desktop flows that are currently running or are in queue.
Running desktop flows: This card displays the number of running flows per period of time. It allows you to see if some of your desktop flows are stacked during their execution or if there's throttling on specific machines.
Running desktop flows and desktop flow in run queue: These cards display the list of flows that are running or are currently in queue. You can select Requested items to reach the run details page, Desktop flow items to reach the desktop flow details page, and Target items to reach the machine or machine group details page.
Note
Limitations: Target for run queue table doesn't display information for standalone machines.
Monitor desktop flow activity with Power BI desktop
Power Automate enables you to download a Power BI template to monitor desktop flow activity from the Power BI desktop application. Learn more about Power BI desktop.
You can use this template to retrieve the data and charts displayed on the desktop flow activity page, such as last runs, main errors, and machine information.
Additionally, you can:
- Customize filters and graphs from the existing data in the Desktop flow activity page.
- Add your own data to build your own business dashboards.
- Publish the template to share it with your organization.
Prerequisites
- Install the latest version of the Power BI desktop application.
- Ensure the TDS endpoint is enabled in the selected environment.
Download the Power BI template
To download the template:
Navigate to the Desktop flow activity page, and select Open in Power BI.
Select Get template on the pop-up window and save the template locally on your machine.
Once the template has been downloaded, open it in the Power BI desktop application.
On the first screen, provide your orgId and select Load. You must sign in with your organization account the first time you open the template.
Note
You can copy the orgId from the pop-up window in Power Automate.
Once the template is open, you can save it as a standard PBIX file to avoid re-entering the orgId.
Limitations
Some data aren't available in the Power BI desktop template: current runs, machine statuses, top failed cloud flows, and the see more option.
Power BI desktop is only available in English.
Microsoft can regularly provide updates for this template. You need to redownload the Power BI template if you want to get the latest version of it.
There's no migration of your changes between template versions.
The Power BI model doesn't adjust the timezone based on a user's location or locale. Time is displayed in UTC timezone.