Troubleshooter
The troubleshooter in Power Automate for desktop is a component that allows you to diagnose, and in certain cases, troubleshoot, potential issues that you might face in the desktop application of Power Automate.

The troubleshooter includes six categories of diagnostics:
- connectivity
- sign-in
- Dataverse
- UI/Web automation
- picture-in-picture
- installation issues
- connectivity for cloud runtime
The troubleshooter also hosts the functionality that puts Power Automate in an improved diagnostics state for troubleshooting purposes.
Note
The existing categories don't require you to be logged in to use the troubleshooter.
The troubleshooter can be manually opened via the console and the flow designer, through the dedicated menu under Help > Troubleshooter. It can also be opened via the process file PAD.Troubleshooter.exe, found in the installation folder of Power Automate for desktop.
Connectivity issues
The connectivity issues diagnostic includes a series of steps that are followed in a set order to check whether Power Automate for desktop has the required access to a predetermined list of public endpoints. These are necessary for the desktop application to work without issues.
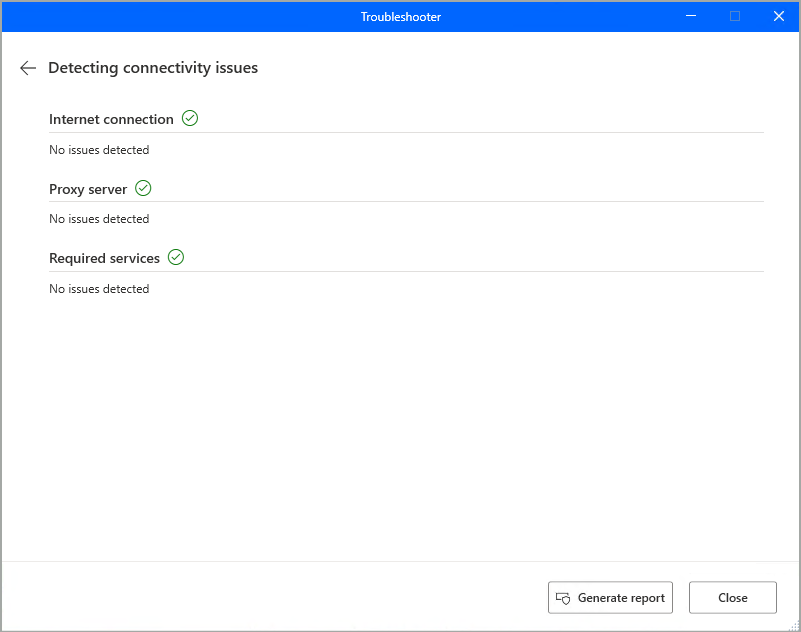
On a high level, there are three steps that are checked one after the other:
- Internet connection
- Proxy server
- Required services
For the internet connection, the troubleshooter checks in sequence:
- If an active internet connection can be detected.
- If there's proper DNS resolution for the endpoints that need to be checked, mapping their domain names to IP addresses.
- If a sample Microsoft page can be pinged.
- If the required endpoints can be reached.
For the proxy server, the troubleshooter checks if there's any proxy related error regarding the endpoints. For the required services, the troubleshooter checks if the endpoints are properly set up and running.
If one step fails with an error, the following steps aren't checked at all, as the success of one check on connectivity issues is a requirement to proceed to the following step.
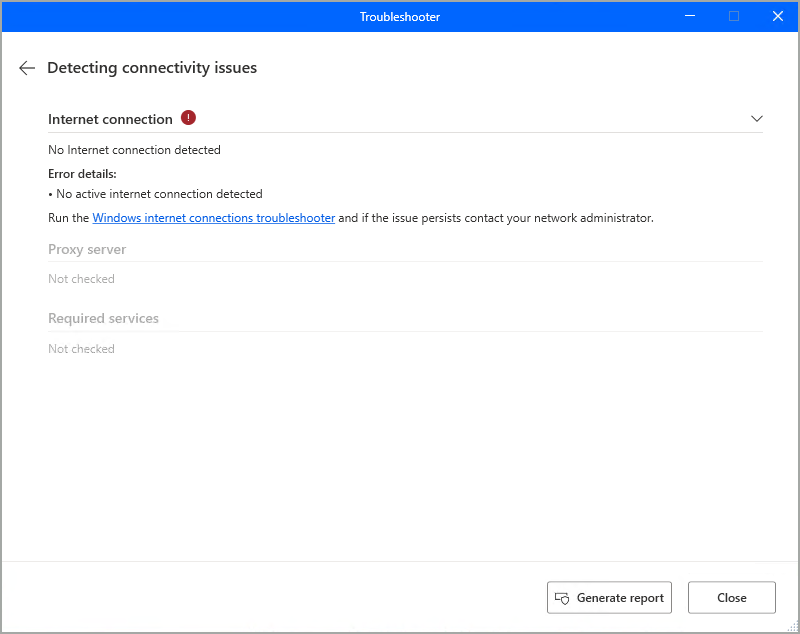
Note
In case of one or more errors, the respective details are displayed in the troubleshooter screen, after expanding the corresponding error.
After a category is checked for issues end to end, there’s always the option to generate the report of that check, which includes all the detailed steps that were followed therein. The report is produced in CSV format and is available independently of whether the check was successful or had errors.
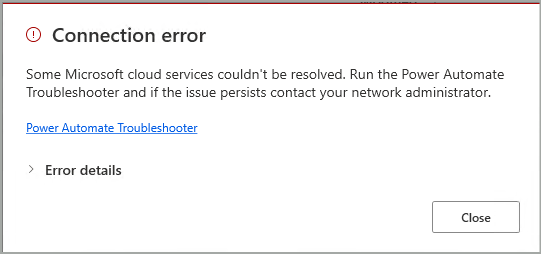
Τhere can be relevant connectivity errors while using Power Automate for desktop. In those cases, you're prompted to launch the troubleshooter directly, through a link in the error dialog. Doing so automatically opens and runs the connectivity issues category.
Sign-in issues
This category detects potential issues when you try to sign in to Power Automate for desktop:
- Authentication: This step checks whether the user is authenticated to sign in.
- Authorization: This step checks whether the user is authorized to sign in.
- Internet options: This step checks whether the required trusted sites are in place or missing.
Dataverse issues
This category detects potential issues around Dataverse that might affect Power Automate for desktop:
- Provisioning: This step checks whether the user can provision a Dataverse database in the selected environment.
- Permissions: This step checks whether the user has the required permissions to access the selected environment.
- Required endpoints: This step checks whether the required endpoints for the respective policies are accessible.
Installation issues
This category diagnoses and troubleshoots potential issues around four different installation types that might be associated to Power Automate for desktop:
- Power Automate installation type: This step identifies the installation type and exact version of Power Automate for desktop that is installed on your machine.
- .NET Framework version: This step identifies whether the minimum .NET Framework version (4.8.1) is installed on your machine, so that Power Automate for desktop can work properly.
- WebView2: This step verifies whether WebView2 Runtime is installed on your machine.
- Windows Update: This step checks if there are any pending updates for your Windows on your machine.
Verbose logging
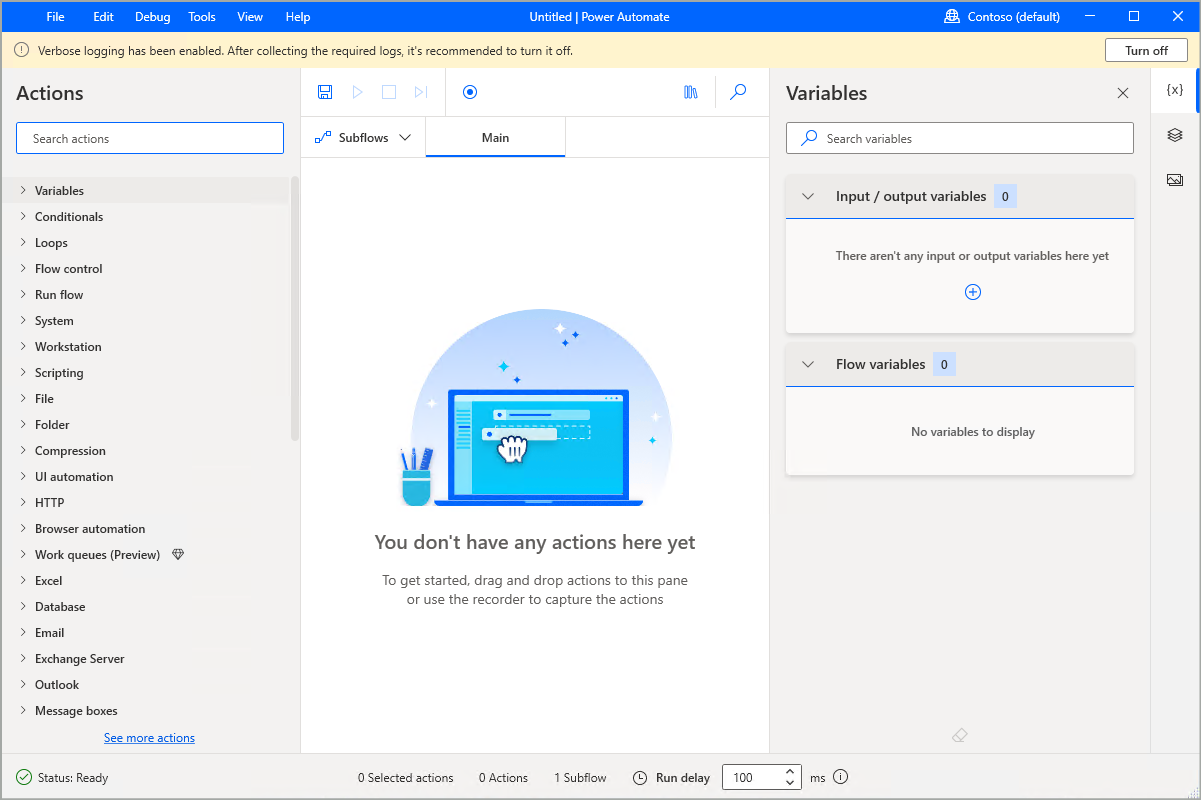
Apart from the various diagnostics, the troubleshooter also hosts the verbose logging functionality. As per the respective description in the troubleshooter app, the toggle button can be turned on and off, forcing the Power Automate desktop application to function in a verbose logging state. This means that any action taken from you, from that point on, is logged with verbose details in local files. The log files are generated in the default path mentioned in the description (PowerAutomateVerbose subfolder in your Documents folder).
Because of this feature’s nature, we recommend that you not leave verbose logging on permanently as there might be slower performance and capacity issues. While verbose logging is enabled, Power Automate constantly produces files with verbose logs, which might eventually consume a larger disk capacity. So enable this mode only for the purposes of reproducing the issue faced and capturing the respective logs, before turning it off again.
There are two registry entries related to verbose logging, as explained in Improve troubleshooting of the Power Automate troubleshooter and Turn on verbose logging state in Power Automate for desktop.
When verbose logging is enabled, the corresponding info banner appears in the console and all the flow designers that are open at the same time. This is so you know that you're in a state that shouldn't be used permanently. You can turn off the functionality directly through that banner.
The console and the designer are affected immediately, when verbose logging is enabled. This means that from that point on, your actions produce verbose logs.
Note
This is not the case for a recording session, or a flow that may be already running - those scenarios respect the state of verbose logging at the beginning of the corresponding procedure, and aren't affected in real time. In other words, verbose logging needs to be already on, before starting a recording session or running a flow, for the respective events to be logged under the verbose state.
When you turn off verbose logging, the Export logs button becomes available in the troubleshooter window. This allows you to collect all the produced log files and zip them in a single .zip file for convenience, before deleting the original individual files.
Known issues and limitations
When Export logs is used when at least one flow designer is open, not all files can be saved in the .zip file, as some of them are used in the designer process. Those files can’t be automatically deleted.