Note
Access to this page requires authorization. You can try signing in or changing directories.
Access to this page requires authorization. You can try changing directories.
This article explains the meaning of the various changes (colors, numbers, and more) in the controls for your process during animation play.
Display the significance of values
The Show significance values options set the mode with the color highlighting of edges and nodes in the animation.
Setting for all nodes and edges: Select Global to highlight the current value in color in chart edges and nodes compared to all values of all nodes and edges in the entire simulated process. This means that the thickest edge or the most highlighted node represents the global maximum for the whole duration of the process.
A node is highlighted if the number of currently incoming events is significant compared to the global maximum of all events ongoing at the same time or in the aggregated interval in one node.
An edge is highlighted if the number of its currently ongoing transitions is significant compared to the global maximum of all transitions ongoing at the same time or in the aggregated interval in one edge.
Setting for current nodes and edges: Select Locally to highlight the current value in color in chart edges and nodes compared to the current values of all nodes and edges in the simulated process. Thus, the thickest edge or the most highlighted node represents the local maximum for the present moment.
A node is highlighted if the number of currently incoming events is significant compared to the current maximum of events ongoing at the same time or in the aggregated interval in one node.
An edge is highlighted if the number of its currently ongoing transitions is significant compared to the current maximum of transitions ongoing at the same time or in the aggregated interval in one edge.
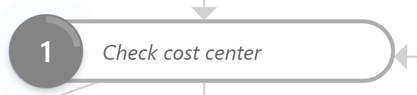
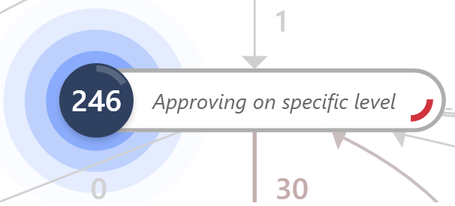
Understand number and color highlight of a node
The number at the chart node represents how many events of the given activity are currently in progress. The color highlight makes it possible to easily distinguish how many events are dealing with the activity at the moment. During the animation, you can easily see which activities often take place in parallel.
To learn more about color highlighting, go to Display the significance of values in this topic.
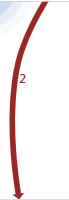
Understand number and color highlight of the edge
The number at the chart edge represents how many transitions between activities are currently in progress. This tells you how many pending cases are waiting for the next event to take place. The color highlight of the edge allows you to easily identify if there are too many cases concurrently waiting for an activity to take place.
To learn more about color highlighting, go to Display the significance of values in this topic.
Activity Progress
The following example shows the highlighted progress indicator for an activity in the process. This indicates the proportion of the count of already performed events of the activity compared to the total count of events of this activity in the process. If all events of the given activity being present in the process in question have already been played back in the animation, the indicator will fill the entire circle.