Note
Access to this page requires authorization. You can try signing in or changing directories.
Access to this page requires authorization. You can try changing directories.
Use this article if you're already familiar with the basic functionality of the Power Automate Process Mining desktop app and understand the basics of process mining. It offers a methodical introduction to the calculation methods after which you'll be able to define the desired calculation scope.
Metrics in Power Automate Process Mining
The Process Mining desktop app offers a wide set of predefined standard metrics (for example, number of events, number of cases, average duration of cases, number of variants, and more). These metrics might be separated in two basic groups:
Aggregated metrics: Most common result. Display calculated values grouped by selected context across the Process Mining desktop app.
Non-aggregated metrics: Display values per individual data element like event, edge, or case.
Aggregated metrics
Aggregation or calculation is done over certain calculation scope or context. Scope is defined by different analytical views in the Process Mining desktop app. This example uses the process map.
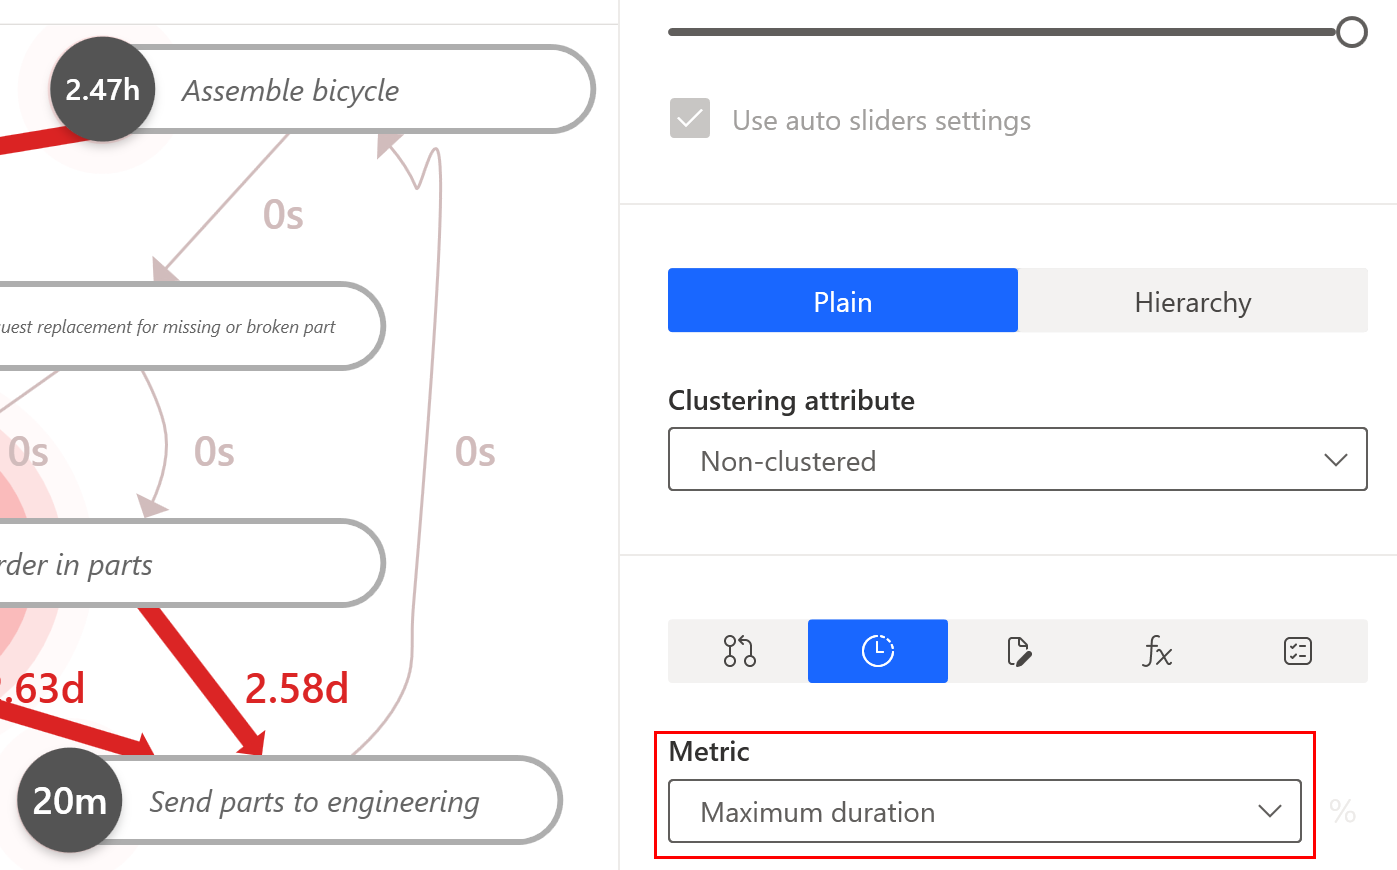
Process map is the most common type of display for process mining analysis. Each element of the map - node (activity) or path (edge) displays an aggregated value for all events with the same activity value. In the example below, you see the representation of two activities: Assemble bicycle and Send parts to engineering. For both nodes, the displayed value represents 109 single events in the data set and displays the aggregated value for all of it. In this case, it's the total number of events.

When you select another metric (maximum duration) in the right panel, the process map displays the maximum duration which occurred among 109 events with activity Assemble bicycle and maximum duration among 109 events with activity Send parts to engineering.
The statistics panel per single attributes uses the same aggregation as the process map, which aggregates the results per attribute value. If you have a resource (for example, a user attribute in statistic panel), you're able to see result per each user occurred in actual view.
The Process Mining desktop app displays aggregated results in three main categories:
Single result: Usually a single global value per actual data set, for example, number of cases. Input is a whole data set and output is a single result.
Aggregation per single case: In Statistics, the Case overview panel results are calculated per single case. Calculation scopes for such aggregations are case events or case edges. Input is set of events or edges within case. Output is a set of results, and single result per single case.
Aggregation per attribute value: Most common calculation scope, and is represented by Process map or Statistics panel for any attribute. Input is a set of events or edges with the same value of selected attribute. Output is set of results, single result per each attribute value. The default Process map uses attribute activityName to calculate results per each set of events with the same activityName value.
In the Statistics Case overview panel, you can see a global single result for the total count of all events in view. In the same panel, there's a list of all cases. In a table of cases, there's a column named Event count. This time, the value represents the number of events in the case. This grouping is called aggregation by single case.
In the Statistics activityName panel, there's a list of all activities. The table of activities contains a column named Event frequency. This time, the event count is calculated per each activity. This grouping is called aggregation by attribute value.
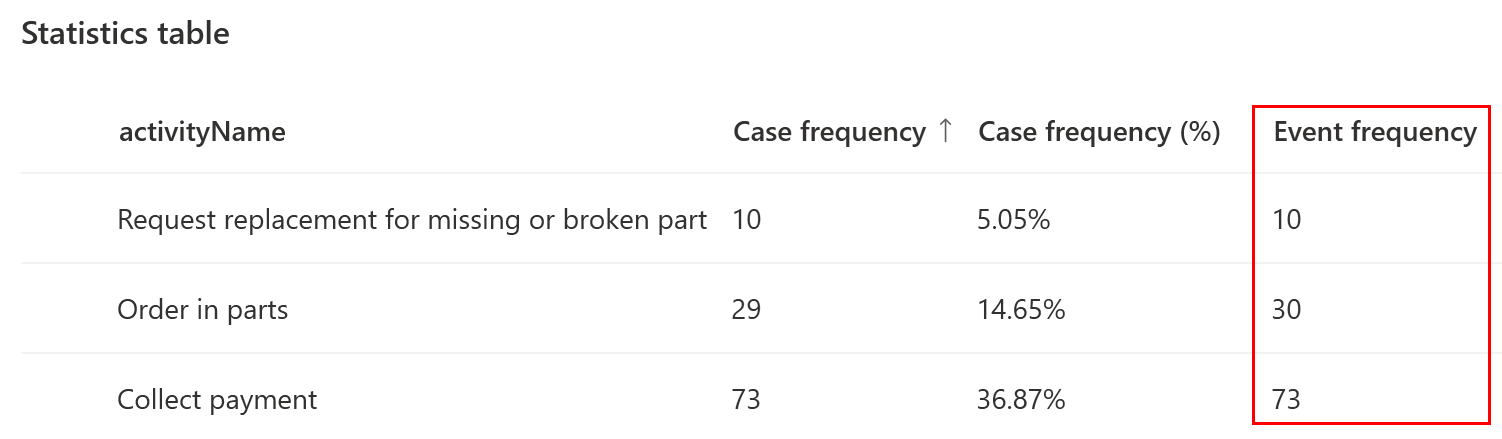
We've seen value 109 for activities Assemble bicycle and Send parts to engineering in the Aggregated metrics section previously in this article. Calculation for all three metrics categories is the same, and the only difference is calculation scope. The first example uses all view events and calculates single result. The second one generates the result per single case and uses per each result only for events within given case. The last one generates the result per each activity and uses per each result only events with the given activity value.
Non-aggregated metrics
The major difference to aggregated metrics is that calculation is done per single element: either case, event, or edge. An example is if an event has assigned a resource attribute, or if case duration is outside defined working hours. There are only a few places where non-aggregated metrics (and attribute values) are displayed and available:
Statistics panel for case overview where values per single case are displayed. Be aware, the displayed metrics are result of aggregation per single case (over events within given case), but from case level perspective these are non-aggregated metrics as represents single case.
Case/event metric filters are among a few places where non-aggregated values are displayed and available to user.
The Event metrics filter is a good example of where duration of single events is displayed and evaluated. Event filters take each event individually and evaluate its attribute or metric value as it is. All other standard visualizations in the Process Mining desktop app display event duration in some aggregated way (for example, mean, total, minimum, or maximum).
Custom metrics
Custom metric is a named calculation formula defined by user per process. This custom metric is applied by the standard ways for how the Process Mining desktop app displays the data. It displays standard metrics in an aggregated and non-aggregated way. Custom metrics must follow the same rule. Therefore, there are two main different types of custom metrics:
Scalar (non-aggregated) formulas—Calculation over single element like case, edge or event: Simple scalar formulas don't contain aggregation operation in its formula. In more complex examples, it's possible to use aggregation as part of nested expression (for example, compare event duration to average duration of all events). The important rule is the result of scalar formula is generated per single case, edge or event. Individual results aren't further grouped nor processed by application into aggregated results.
Aggregated formulas—Calculation over certain calculation scope or ‘context'. User can alternate context in formula: Aggregated formulas contain aggregation operator (for example,
AVG) at a top evaluation level. The Process Mining desktop app offers a set of standard aggregation operators - see Custom metrics help for reference. Aggregation operation as first argument takes calculation scope. This determines two properties:Input set of data taken into account
Grouping or granularity of the results
Input set of data
You determine what part of the data set is taken into calculation. Calculation of average event duration for the process map is required to take into calculation only events which belong to the same activity.
Grouping or granularity of the result
Another aspect of the calculation scope is to determine the granularity of result. Average event duration in the whole view is a single number, and the count of results is exactly one. Calculating values for the process map requires the number of results to match number of nodes (for example, activities) in the process map. We already know there are three main categories for how results are grouped:
- Single global result
- Aggregation per single case
- Aggregation per attribute value
Generic form for custom metric formulas
Consider the following task: Calculate average revenue per hour for invoice processing in cases when order number was entered manually, and invoice status was never rejected.
Logical breakdown for a generic form
The following table provides examples and descriptions of custom metrics.
| Example | Description |
|---|---|
| Aggregation | Aggregation converts multiple results (for example, per case) into a single value. If the aggregation part is missing, we have scalar, non-aggregated metric. |
| Calculation | Standard calculations in the Process Mining desktop app are: Total(sum), Mean(avg), min, `max. Advanced calculations like ratio of two attributes need to be done with custom metrics. |
| Data filtration | Filtration in the Process Mining desktop app can be done with filters, custom metrics with conditional operators, or business rules with filters. |
The example shows the possibility to perform advanced filtering in custom metrics. To make the example easier, we'll focus on the aggregation and calculation part. When we create the view, filters which fit the requirements of "order number was entered manually, and invoice status was never rejected" we might simplify the task.
The simplified task
Calculate average revenue per hour for invoice processing for cases in actual view.
Logical breakdown for a simplified task
The following table provides examples and descriptions of custom metrics.
| Example | Description |
|---|---|
| Aggregation | Aggregation converts multiple results (for example, per case) into a single value. Scope of aggregation is defined by context definition. |
| Calculation | Standard calculations in the Process Mining desktop app are: Total(sum), Mean(avg), min, max.Advanced calculations like ratio of two attributes need to be done with custom metrics. |
| Data filtration | Simplified filtering means the scope or context definition. |
Generic formula for aggregated custom metrics
Aggregation([Data filtration/scope], calculation)
Replace the generic placeholders with actual operators and expressions:
Avg(ViewCases, 1.0 * InvoiceTotalAmountWithoutVAT / TOTALHOURS(Duration()))
The aggregation part is represented by the simple average operator (avg).
Calculation scope is the first part to define in the formula itself. We're looking for a single global result using all cases in the view. This is easily achieved by selection of ViewCases value for context definition. Other types of using aggregated results, like per single case or per attribute value, have no use in this example.
Core calculation is completely done through an expression that contains four elements:
Conversion to float ("1.0 *")
Attribute specification ("InvoiceTotalAmountWithoutVAT")
(Case) duration converted to time unit ‘hour' (TOTALHOURS)
Division to calculate ratio