Note
Access to this page requires authorization. You can try signing in or changing directories.
Access to this page requires authorization. You can try changing directories.
With process variants, you can accurately explore all possibilities of how a process can develop and identify problematic scenarios (for example, a transition variant with an unusually high number of events). The quantity of variants makes it possible to accurately identify the most frequent scenarios occurring in the process. This way, you can easily and quickly determine which process scenarios require your attention.
The careful examination of process variants can help you uncover various scenarios and situations that occur in the process. With filtering by variants, the analyzed process can be easily restricted to only those parts or scenarios that are of interest for achieving the final objective of the analysis. A process variant is an organized sequence of activities that corresponds to the course of at least one case in the process under analysis. All cases in the process in which the same activities are performed in the same sequence fall under one variant.
The decisive condition for determining the respective variant and the arrangement of events is the event start time.
Variant mining attribute
Similar to a process map, which is by default generated using activities but can be switched to a resource viewpoint (similar to a social chart in the process map), the list of variants is generated using the selected mining attribute. In the same way, the variants overview can be generated using different relevant event log attributes (for example, department, plant, or region). This selection is independent of the selection of mining attributes on the process map.
Variant names
Process variants are among the results of process mining. They're labeled by a number that's used consistently on all process analysis screens regardless of any applied filters.
Components of the Variants screen
To open the Variants screen, go to the open view and select Variants on the left menu.

The default screen contains three panels:
Attribute panel
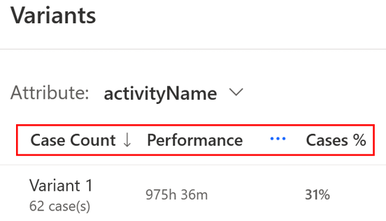
In the first panel next to the menu, you'll see a list of process variants. This is sorted by the count of occurrences of cases under the variant by default.
Select (...) to sort the list of variants by Event count or Performance. You might also see a Finance option. This is available only when there is a finance attribute in the process. Performance and finance sorting criteria contain a list of available sub-criteria, which enables further options for sorting.
Sorting by Case Count displays a total number of cases for a variant in a single case. Select the up or down arrow next to the sorting criteria name to change the sort order (ascending or descending).

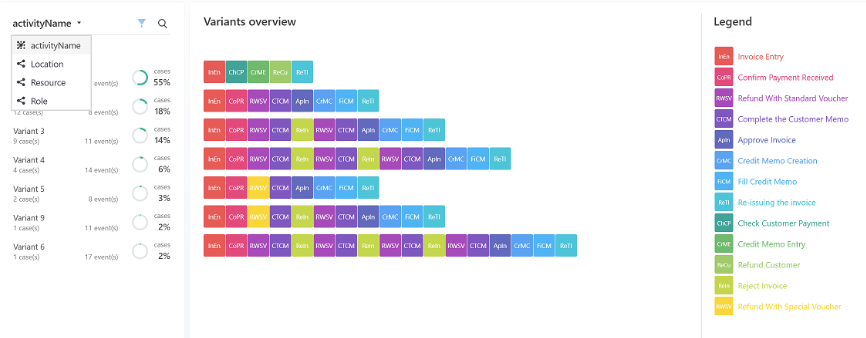
Variants overview panel (variant DNA)
All cases for the selected variant appear in the center panel. This is lso where you can see variant DNA.
The variant DNA view allows you to:
Get a visual overview of all the process variants found in the current open process view
Get a glimpse of process characteristics and variations of the process
Get a glimpe of process standardization level
Identify differences or repeated patterns
Identify similarities of variations
To display Variant DNA:
Make sure that no variant is selected in the list.
Select any of the available variants by selecting it in the list on the first panel next to the menu.
Legend panel
Lists the full names of the abbreviations in the Variants overview panel.
Search for case specific data
You can get specific data for a variant. When you select a variant in the left panel Case Count column, you'll see three tabs:

Variant overview tab
Get a map of activities on the left, where you can observe the duration of activities and edges of the variant in the Variant Overview tab. The statistical indicators of selected variant metrics are present on the right. The graph shows the distribution of cases over time. The blue part represents the overall distribution. The orange part represents the selected variant.
Cases table tab
Explore each issue individually in the Case table tab. In the center panel, there's a list of all cases under the variant sorted by their case ID. Each issue can be explored individually.
To see the details of its development, select a case number in the Case ID column. The events of the selected case appear on the right column.
Cases gantt tab
Development of the case on a timeline in the Cases gantt tab. The following information about each case is available:
Start and end time for the case
Name of the performed activity
Visualization of the duration of the activity on the timeline
The parallel flag means that the activity runs in parallel with another activity.
The parallel conduct of the two activities can be clearly seen on the timeline.
Waiting time for another activity after the completion of the current activity
When you select the black dot within the time progress of the activity, all information about the activity displays.
Customize settings
Change the setting in any panel or tab in the Variants screen.
On the menu at the top-right, select View Settings.
Choose from General settings, Duration settings, Activity label, and Calendar settings.
By default, each activity has its own color. Use the Activity label to display the same color for all activities with the same label.
Select Save.