Note
Access to this page requires authorization. You can try signing in or changing directories.
Access to this page requires authorization. You can try changing directories.
[This article is prerelease documentation and is subject to change.]
Configure and use process map visualizations in the process intelligence experience to display your process flow with activities, transitions, and performance metrics.
Important
- This is a preview feature.
- Preview features aren’t meant for production use and may have restricted functionality. These features are available before an official release so that customers can get early access and provide feedback.
- For more information, go to our preview terms.
The process map visualizes your process as a flow diagram with activities (nodes) and transitions (edges).
Customize a process map
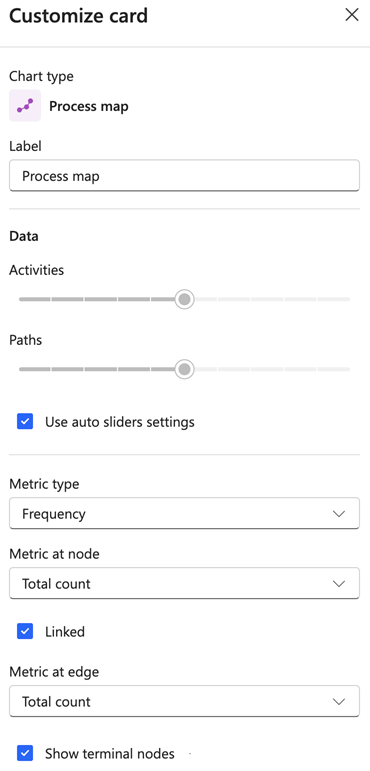
To customize a process map, select the card context menu and select Customize card.
Chart type
The chart type is Process map.
Label
In the Label field, enter a custom name for your process map card. The default label is Process map.
Data settings
Activities
To control how many activities display in the process map, use the Activities slider. To adjust the complexity of the visualization, move the slider.
Paths
To control how many paths (edges) are displayed in the process map, use the Paths slider. To adjust the number of transitions that show, move the slider.
Use auto sliders settings
To automatically adjust the Activities and Paths sliders for optimal visualization, enable Use auto sliders settings. This option is enabled by default.
Metric type
To determine what kind of metric that displays on the process map, select the Metric type.
- Frequency: Show metrics related to how often activities and paths occur.
- Performance: Show metrics related to duration and timing.
- Rework: Show metrics related to repeated activities.
- Finance: Show metrics related to cost.
Metric at node
From the Metric at node dropdown menu, select what metric to display on activity nodes. The options depend on the selected metric type. The default is Total count.
Linked
To synchronize the metric selection between nodes and edges, enable Linked. When enabled, changing the metric at node automatically updates the metric at edge. This option is enabled by default.
Metric at edge
From the Metric at edge dropdown menu, select what metric to display on transition edges. The options depend on the selected metric type. The default is Total count.
Show terminal nodes
To display the start and end nodes in the process map, enable Show terminal nodes. This option is enabled by default.