Note
Access to this page requires authorization. You can try signing in or changing directories.
Access to this page requires authorization. You can try changing directories.
[This article is prerelease documentation and is subject to change.]
Configure and use statistical grids in the process intelligence experience to display process statistics and metrics in a structured tabular format.
Important
- This is a preview feature.
- Preview features aren’t meant for production use and may have restricted functionality. These features are available before an official release so that customers can get early access and provide feedback.
- For more information, go to our preview terms.
The statistical grid displays tabular data in a structured format, making it useful for presenting process statistics and metrics.
Configure a statistical grid
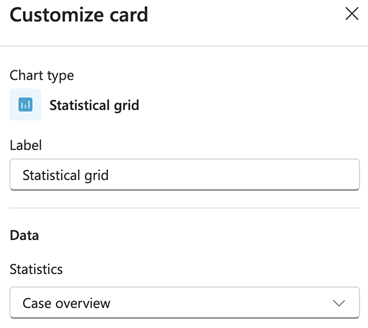
To configure a statistical grid, select the settings icon on the card to open the customization panel.
Label
In the Label field, enter a descriptive name for the card. This label appears as the card's title on your dashboard.
Data
From dropdown menu in the Statistics field, select which statistical data set to display. The options depend on your process data and configured statistics.
The statistical grid displays the selected statistics in a table format. It shows the relevant metrics and values for your process analysis.