Note
Access to this page requires authorization. You can try signing in or changing directories.
Access to this page requires authorization. You can try changing directories.
When you view reports in the Power BI service (https://app.powerbi.com), you might want to further enrich the report data with other assumptions, perform what-if analysis, or validate the numbers in a specific Power BI visual or an entire Power BI report.
In this article, you learn how to create Excel workbooks containing connected Power BI data that you can refresh directly inside the workbook. That way, you can focus on your analysis in Excel and be confident that you're working with up-to-date data.
Prerequisites
The following are prerequisites you need before proceeding.
- Your organization’s tenant administrator must enable the Users can work with Power BI semantic models in Excel using a live connection tenant setting. Learn more about the Excel live connection tenant setting in the admin portal documentation.
- For on-premises datasets, your organization’s tenant administrator also must enable the Allow XMLA endpoints and Analyze in Excel with on-premises datasets tenant setting. Learn more about the Allow XMLA endpoints tenant setting in the admin portal documentation.
- You must have Build permission to the Power BI semantic model or have at least a Contributor role in the Power BI workspace containing your semantic model.
- You must have a Power BI license: Fabric Free, Pro, or Premium Per User (PPU). Fabric Free license users can only work with datasets in My workspace or a Power BI Premium capacity or Fabric F64 or greater capacity. Learn more about Power BI licenses.
- You can use Excel workbooks containing refreshable Power BI data in both Excel Desktop and Excel for the web.
Evaluate in Excel choose Power BI data
Power BI provides you with options to ensure that you can extract the right granularity of data depending on how you want to analyze that data in Excel, either with Excel PivotTables or Excel tables. In the Power BI service, use the following two features to create an Excel workbook:
- Analyze in Excel
- Export to Excel with live connection
- Create connected PivotTables and Tables in Excel
Analyze in Excel
With Analyze in Excel, you can create an Excel workbook containing the entire semantic model for a specific Power BI report and analyze that semantic model in Excel using PivotTables, Pivot Charts, and other Excel features.
In the Power BI service, you can use any of the following Analyze in Excel entry points to create an Excel workbook:
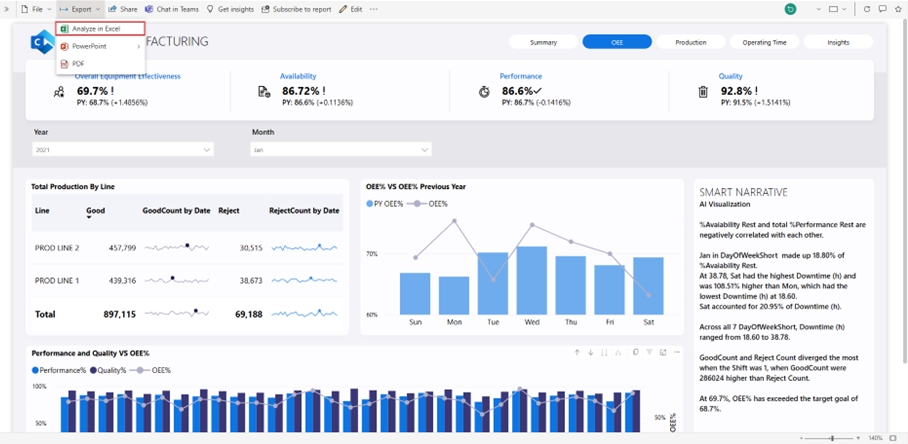
Open a Power BI report. Select Export > Analyze in Excel from the top ribbon.
Go to the workspace containing your Power BI semantic model or report, select More options (...) next to the semantic model or report name and select Analyze in Excel.

Select a semantic model in a Power BI workspace. In the Semantic model details page, select Analyze in Excel on the menu bar.


After you select Analyze in Excel, Power BI generates an Excel workbook and saves it to your OneDrive SharePoint account. It has the same name as the Power BI report, so you can open the workbook directly in Excel for the web.

Note
If you don't have a OneDrive SharePoint account, Power BI downloads the Excel workbook to your local computer.
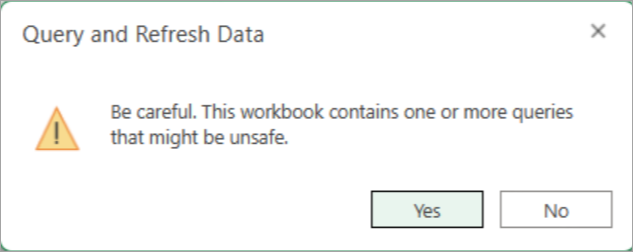
When you choose Open in Excel for the web, your Excel workbook opens in a separate browser tab. To enable the Power BI query in Excel, select Yes on the Query and Refresh Data dialog.
After you select Yes in the dialog, you can see the tables and measures from your Power BI semantic model in the PivotTable Fields. You can start building your PivotTable reports in Excel.

If you want to work with your data in the Excel Desktop app, select the Editing button in the ribbon and select Open in Desktop app.

Export to Excel with live connection
While viewing a Power BI visual, you can further explore the visual data in Excel and keep the data connected. You can export a table of refreshable data from a Power BI visual to Excel:
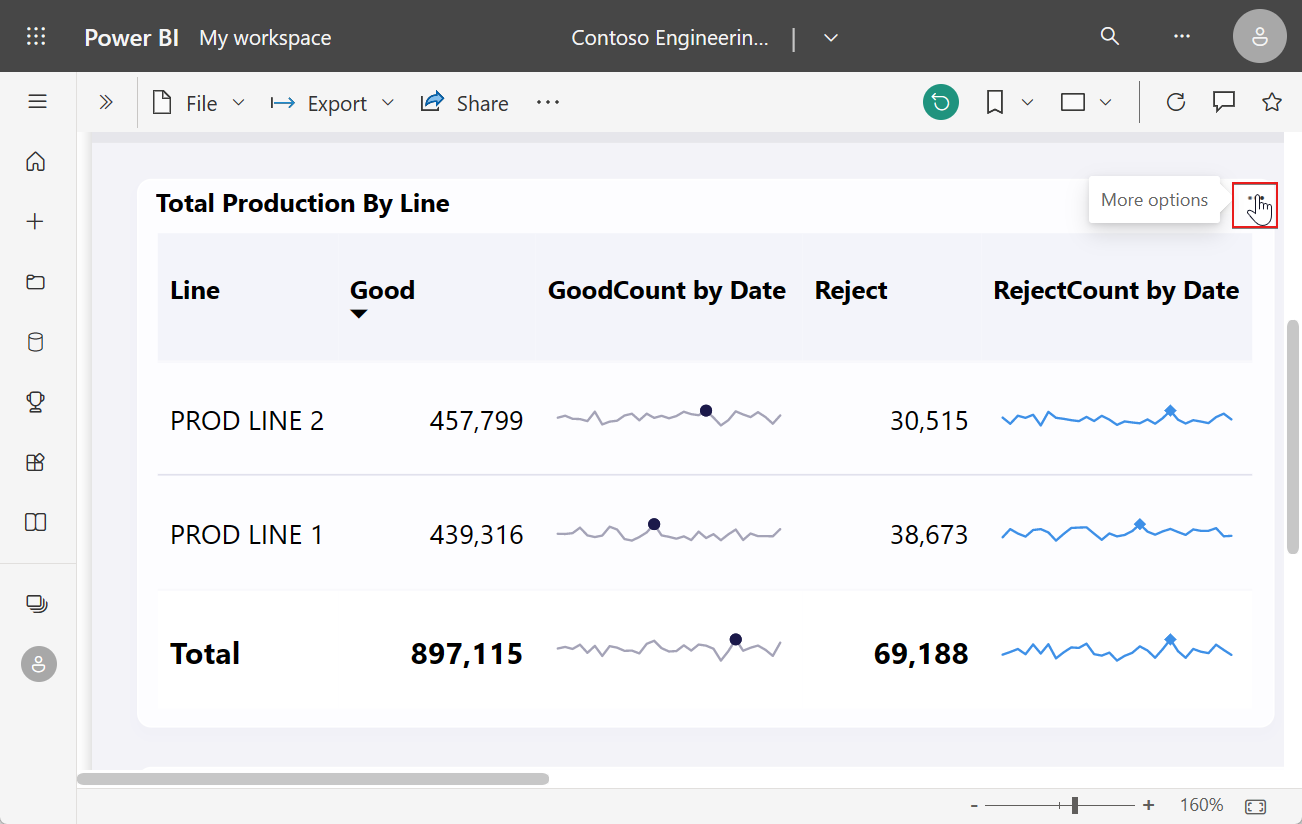
Choose a visual in a Power BI report, select More options (…).
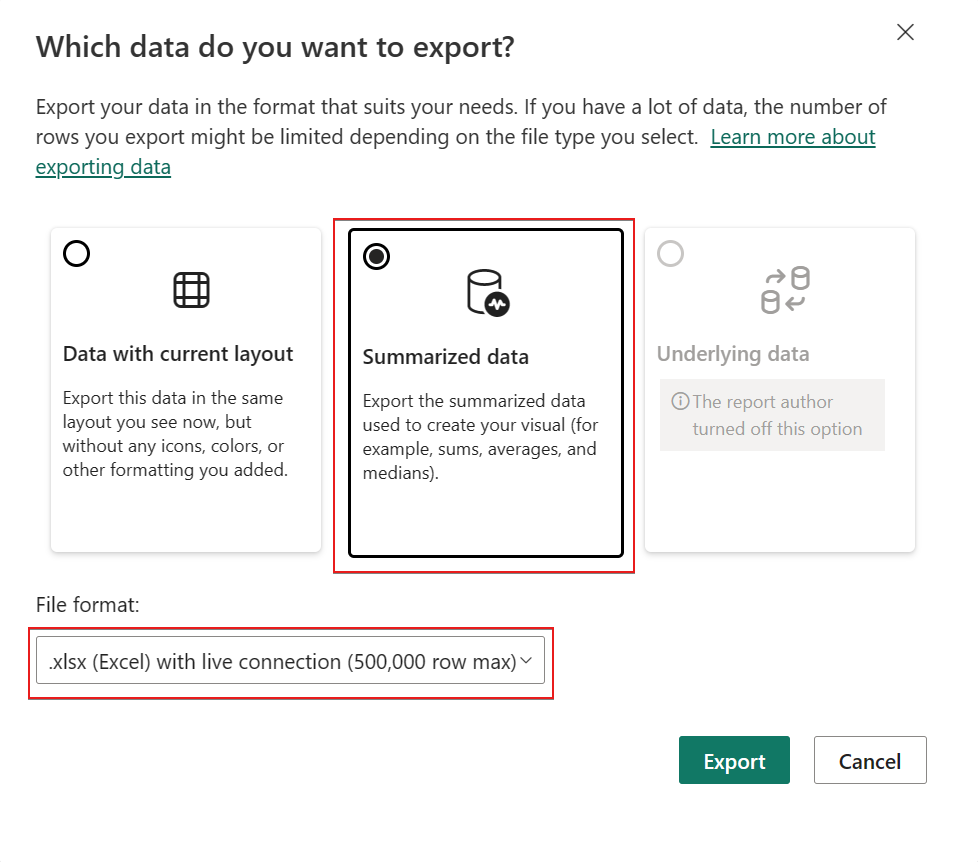
On the Options menu, select Export data. You have different options to select what type of data you want to export to Excel.

Select the Summarized data card, and choose the .xslx (Excel) with live connection (500,000 row max) option under File format.
After you select Export, Power BI downloads an Excel workbook containing the live Power BI data to your computer.
The first time you open the Excel workbook, it might open in read-only mode until you select Enable Editing, depending on your Protected View settings in Office.

Depending on your Trusted document settings, you might also need to select Enable Content to load the Power BI data to the Excel grid.

The data from the Power BI visual is now visible as an Excel table that can be refreshed against Power BI.
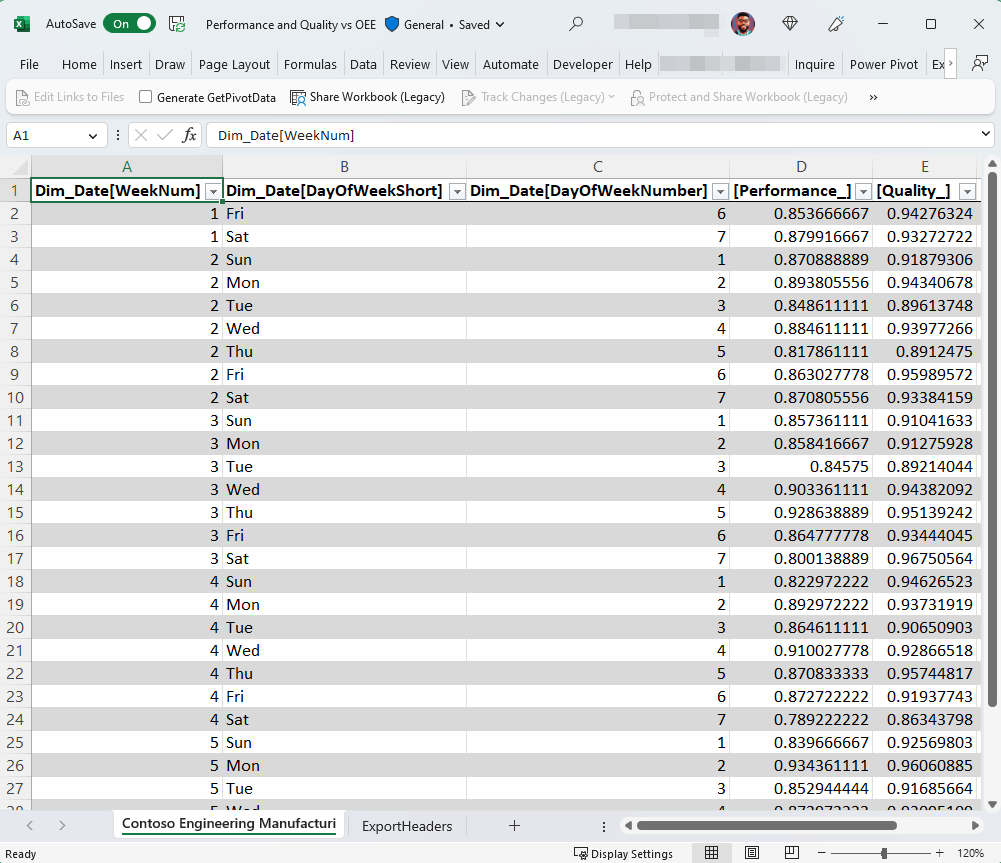
Note
The ExportHeaders worksheet in the Excel workbook contains details about the filters applied to the Power BI visual that the data was exported from.


In addition, you can use the OneLake Data Hub's Table Preview to export an Excel workbook with a live connection.

Excel add-in
You can use the Power BI Excel add-in to insert connected PivotTables and connected query tables starting from Excel. This helps you quickly find and insert refreshable Power BI data into your new or existing workbooks without leaving Excel.
Note
To use the Power BI Excel Add-in, ensure that in Excel Trust Center the following settings aren't checked:
- Disable all Application Add-ins (may impair functionality)
- Don't allow any web add-ins to start.
Note
The connected tables feature is now available in the Microsoft 365 Current Channel. Connected tables are available to all Monthly Enterprise Channel and Semi-Annual Enterprise Channel customers in their next regularly scheduled Microsoft 365 update. The connected tables feature is available for everyone in Excel for the Web. The add-in is visible in Excel for users with a Power BI Pro license.
You can open the Excel Add-in from the Excel ribbon.
Starting on the Insert ribbon:
- Expand the PivotTable drop down
- Select From Power BI (Microsoft)
Starting on the Data ribbon:
- Expand the Get Data drop down
- Expand the From Power Platform menu
- Select From Power BI (Microsoft)
The Power BI add-in Datasets Pane opens in Excel and provides the following capabilities:
- List of Power BI semantic models that you have at build or edit permission on.
- Search for semantic models
- Open OneLake Data Hub in Power BI service in a new browser window
- Open semantic model in Power BI service in a new browser window
- See metadata for datasets like the workspace, owner, and the last refreshed date.
- See the tables in the semantic model
- See the related reports you have access to and open them in a new browser window.
- Insert PivotTable which lets you create a connected PivotTable just like Analyze in Excel does starting from the service.
- Insert Table which lets you design a table and insert it as an Excel query table in the Excel grid, referred to as a connected table.
You can use Excel's refresh capabilities to update the data in the Excel workbook for your connected PivotTable or connected table.
Considerations and limitations
- Row-level security (RLS) and object-level security (OLS) are supported for Analyze in Excel and Export with Live Connection. RLS is enforced at the data-model level while OLS is enforced at the table or column level and both security layers apply to all users who access data in a specific Power BI report. Read more about row-level security and object-level security.
- When inserting a connected PivotTable or connected query table, the Microsoft Purview Information Protection sensitivity label for the semantic model is automatically applied to the Excel workbook. If the Excel workbook has a sensitivity label already, the strictest label is applied.
- For Analyze in Excel, only Power BI semantic models that use Import mode preserve hierarchies in the PivotTable Fields in the Excel workbook. Power BI semantic models that are built on Direct Lake, DirectQuery, or composite models don't retain their hierarchies when you use Analyze in Excel.
- Analyze in Excel doesn't support specifying a locale by modifying the connection string after the workbook is generated.
- You might see an error message if the data is larger than 2 GB. In that case, either reduce the amount of data, for example by applying filters, or use the XMLA endpoint. For more information, see XMLA endpoint.
- Users external to the tenant hosting the Power BI semantic model can't analyze Power BI data nor load Power BI data with live connection in Excel.
- Analyze in Excel and Export with live connection aren't supported in Power BI Report Server or Power BI PaaS Embedded, except for Power BI reports in Premium capacities.
- Analyze in Excel might not work as expected if field parameters are used in the underlying Power BI semantic model.
- Analyze in Excel and Export with live connection aren't available for Power BI semantic models with a live connection to Azure Analysis Services (AAS) or SQL Server Analysis Services (SSAS).
- Say you have a Power BI report that's built on a live connection to a data source, and you add other measures to the report in Power BI. If you use the Export with live connection option to export data from a visual in that report, the measures that you added won't be available in the data you export to Excel. Only measures from the data source are available in the exported data.
- Mac users can only use Excel for the web to explore Excel workbooks containing Power BI semantic models.
- The column name and order in a Power BI visual may not be preserved when data is exported to Excel from that visual.
- If the 'User Datasets Across Workspaces' tenant admin switch is off, users need to use Write permissions to use the semantic model. Learn more about using semantic models across workspaces.
- If you're facing issues with exporting a summarized data card with live connection, please uncheck the "Show items with no data" option and try exporting again.
- If a measure is included in a visual in the form of a format string (e.g. custom number of decimal places), this will not be visible on the visual but will be included in the Query Table (Connected Table) in Excel as part of the Export Data with Live Connection.
Related content
- Now that you created the Excel workbook with refreshable Power BI data, it's time to design a report in Excel with that Power BI data
- Connect Excel to Power BI semantic models
- Questions? Try the Power BI Community