Note
Access to this page requires authorization. You can try signing in or changing directories.
Access to this page requires authorization. You can try changing directories.
Table view helps you inspect, explore, and understand data in your Power BI Desktop model. It's different from how you view tables, columns, and data in the Power Query Editor. With Table view, you're looking at your data after it has been loaded into the model.
Note
Since Table view shows data after it's loaded into the model, the Table view icon isn't visible if all data sources are based on DirectQuery.
When you're modeling your data, sometimes you want to see what's actually in a table or column without creating a visual on the report canvas. You might want to see right down to the row level. This ability is especially useful when you're creating measures and calculated columns, or you need to identify a data type or data category.
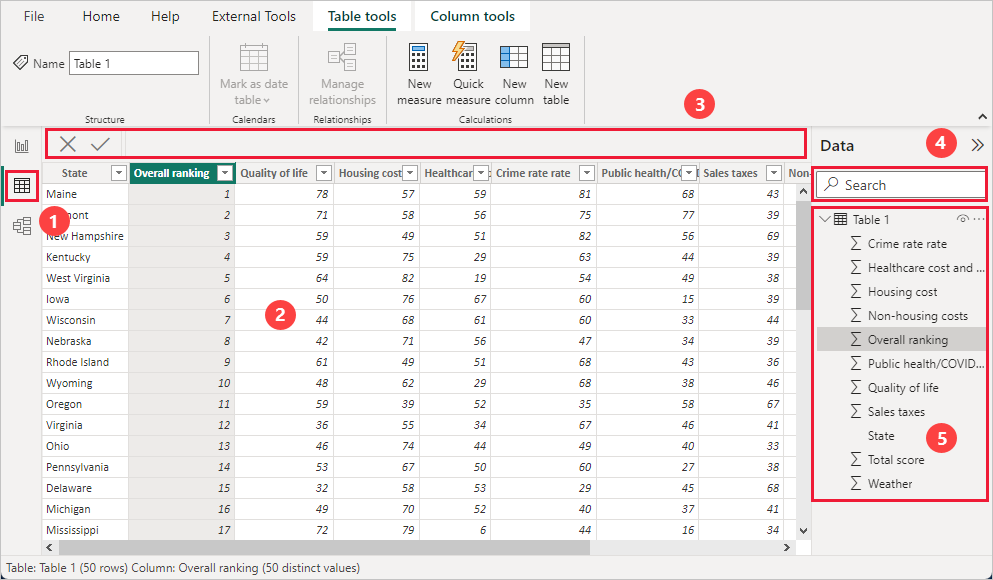
Let's take a closer look at some of the elements found in Table view.
Table view icon. Select this icon to enter Table view.
Data Grid. This area shows the selected table and all columns and rows in it. Columns hidden from the Report view are greyed out. You can right-click on a column for options.
Formula bar. Enter Data Analysis Expression (DAX) formulas for Measures and Calculated columns.
Search. Search for a table or column in your model.
Fields list. Select a table or column to view in the data grid.
Filtering in Table view
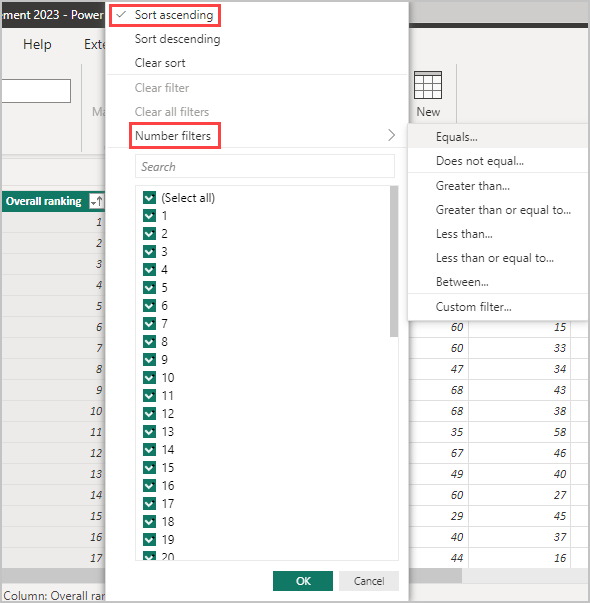
You can also filter and sort data in Table view. Each column shows an icon that identifies the sort direction, if applied.

You can filter individual values, or use advanced filtering based on the data in the column.
Note
When a Power BI model is created in a different culture than your current user interface, the search box doesn't appear in the Table view user interface for anything other than text fields. For example, this behavior would apply for a model created in US English that you view in Spanish.
Copying elements in Table view
You can copy various elements of a table in Table view with a few easy steps.
First, you can right-click any cell to access various options, including copying the entire table, copying a specific column, or copying the cell value. To access these features you can right-click on any cell, then select Copy from the menu that appears. Options to copy the cell value, the column, or the entire table appear, as shown in the following image.

You can also use the keyboard shortcut by pressing Ctrl+C. Copying elements in Table view lets you extract individual cell values directly, eliminating extra steps and making your workflow more efficient.
Related content
You can do all sorts of things with Power BI Desktop. For more information on its capabilities, check out the following resources:
