Note
Access to this page requires authorization. You can try signing in or changing directories.
Access to this page requires authorization. You can try changing directories.
APPLIES TO: ![]() Power BI service for business users
Power BI service for business users ![]() Power BI service for designers & developers
Power BI service for designers & developers ![]() Power BI Desktop
Power BI Desktop ![]() Requires Pro or Premium license
Requires Pro or Premium license
It’s easy to create Power BI reports in Microsoft Teams. This article has a few examples of reports you can create. When you’re ready, you can also use tools like Power BI Desktop for more advanced report authoring.
Create an automatic report from data you have
If you have a table with data, such as an Excel spreadsheet, and want to try visualizing in Power BI, create your report with the help of Microsoft Teams. You can start in Microsoft Teams or the Power BI service.
Create an automatic report with Microsoft Teams
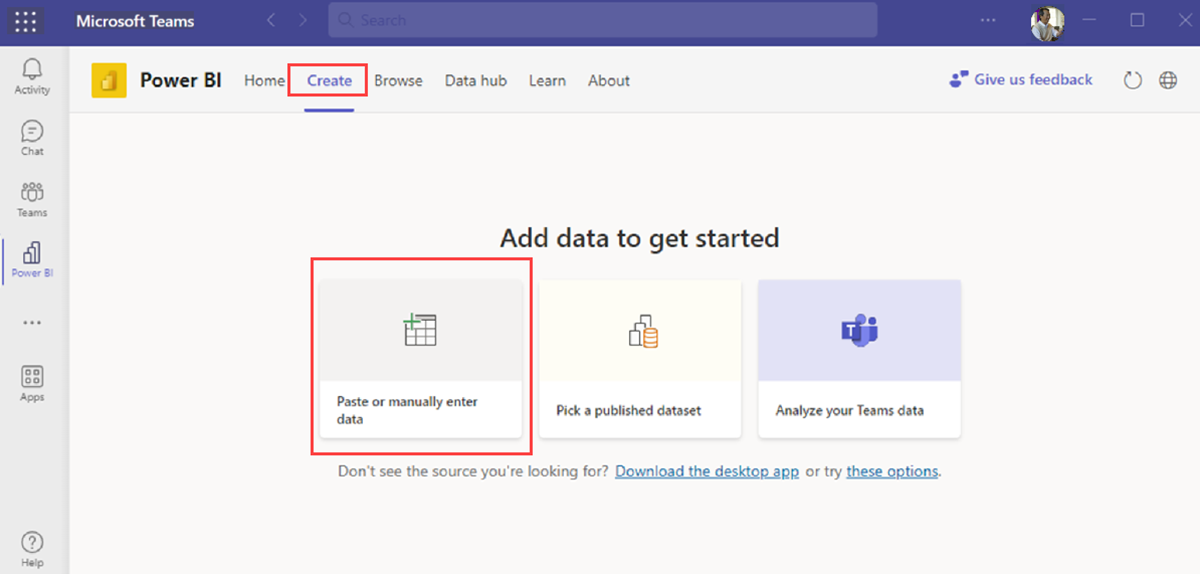
Open the Power BI app from Microsoft Teams.
Need to install the Power BI app? Install the app, then pin it to the Teams navigation pane.
Select the Create tab, then choose Paste or manually enter data to open the Power BI service on your browser.
After the Power BI service opens in your browser, go to Step 3 in Create an automatic report with the Power BI service to finish creating your report.

Create an automatic report with the Power BI service
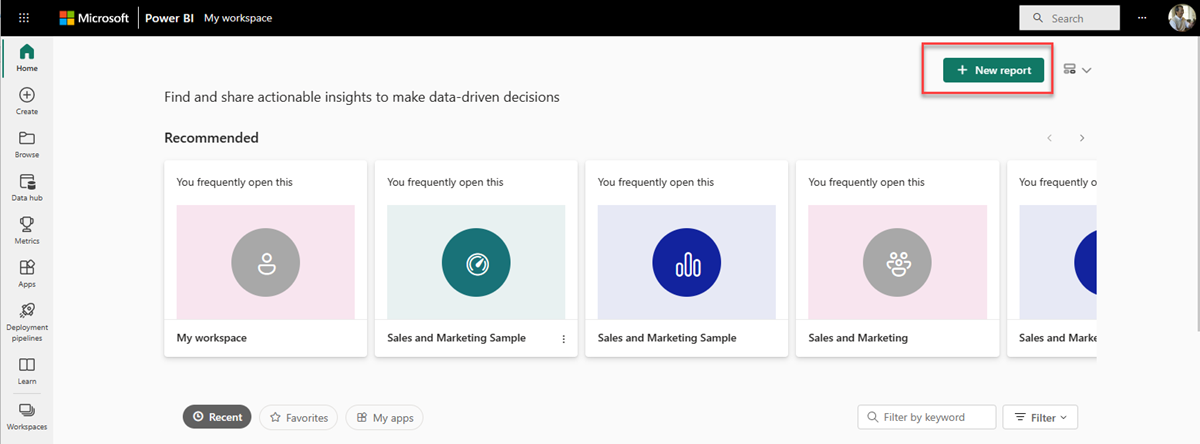
Open the Power BI service.
Select the New report button.
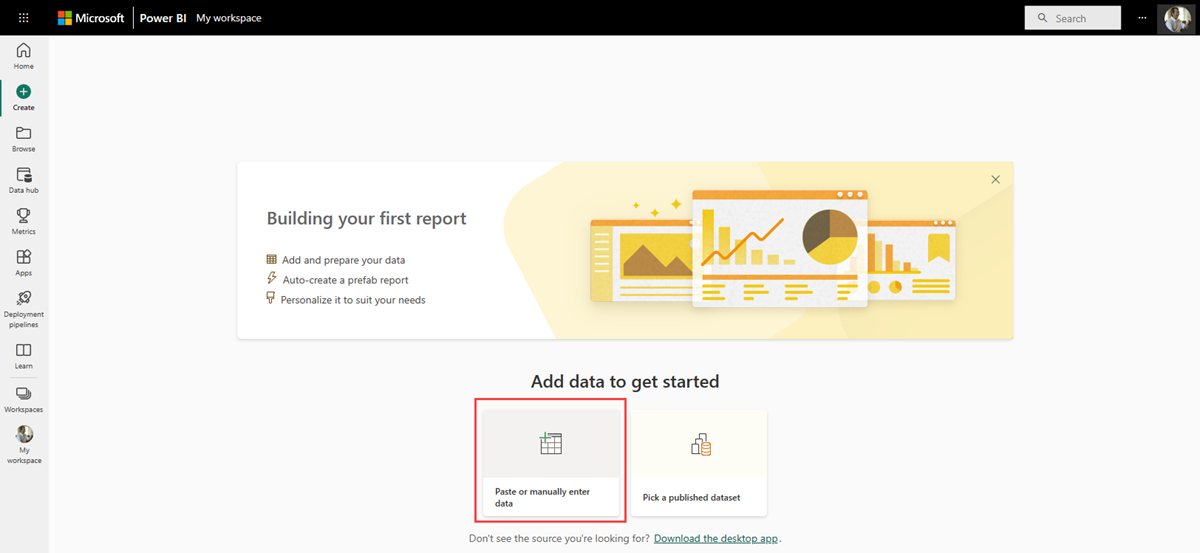
Select Paste or manually enter data.
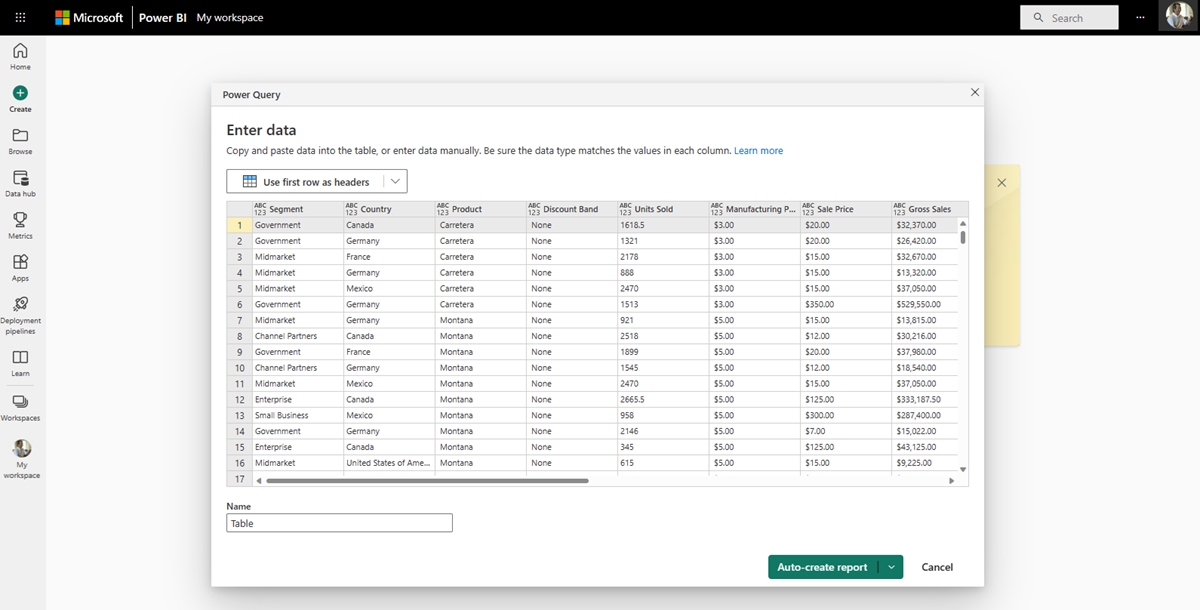
Copy the data or spreadsheet you want to visualize, then select the first cell in the Power Query dialog box and paste the data.
Select Use first row as headers from the dropdown menu if you want to apply the setting. Then name your table and choose Auto-create report.
Set a sensitivity label, if prompted.
Power BI automatically analyzes and visualizes your data in a prebuilt report.
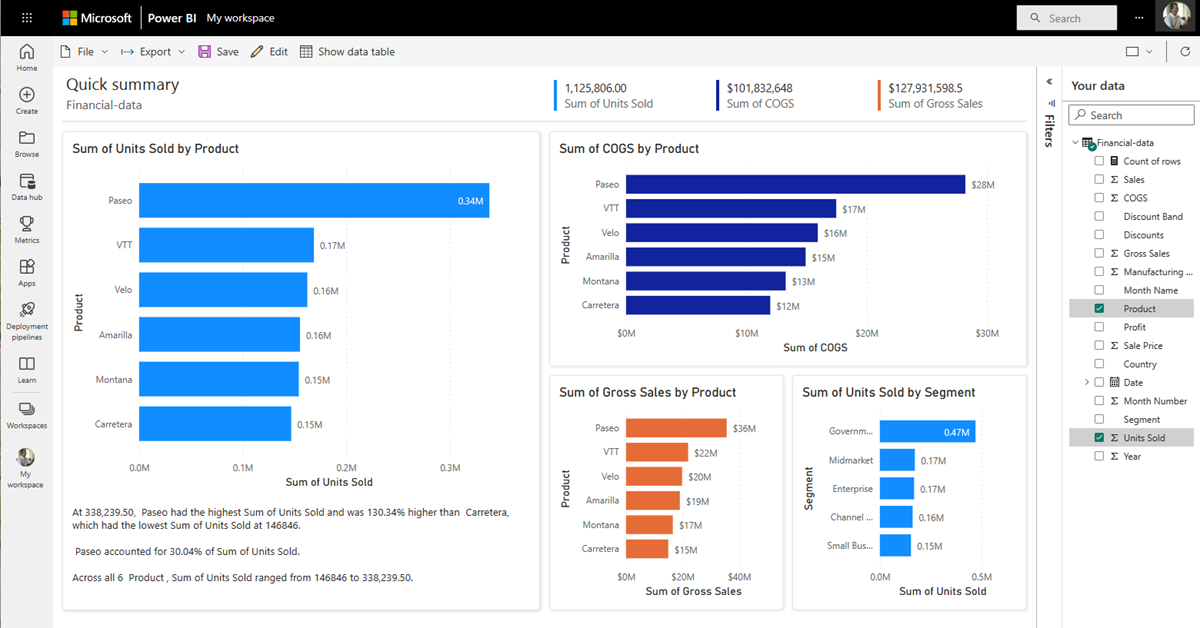
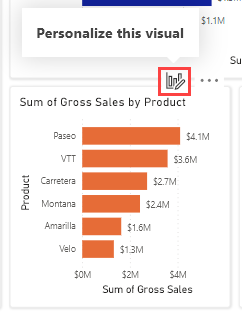
Customize your visuals. If you want to customize a single visual on your report, select the Personalize this visual icon.
Save the report.
After you save the report, you can customize the whole report by selecting Edit.


When you’re done, save and share the report with your colleagues in Teams.
Create a report from a semantic model in your organization
Many organizations share semantic models that you can use to build your reports. These semantic models are great because they offer up-to-date authoritative data. Semantic models marked certified or promoted are likely to be higher quality and better maintained, so your reports keep working longer.
To build a report from a semantic model shared with you, follow these steps.
Open the Power BI app for Microsoft Teams.
Select the Create tab > Pick a published semantic model.
Select a semantic model > Auto-create report.
Start exploring the data.
- Use visualizations like charts, tables, and maps to show data in various ways.
- Select data points to see other visuals update to filter data to your selection. Change formatting to make the report useful and readable by your colleagues.
After you complete your work, save and share the report.
Explore semantic models and reports shared with you
It's easy to find all the semantic models your organization has shared with you. They’re in the OneLake data hub in the Power BI app for Microsoft Teams. Again, semantic models marked certified or promoted are likely to be higher quality and better maintained.
Open the Power BI app for Microsoft Teams.
Need to install the Power BI app? Install the app, then pin it to the Teams navigation pane.
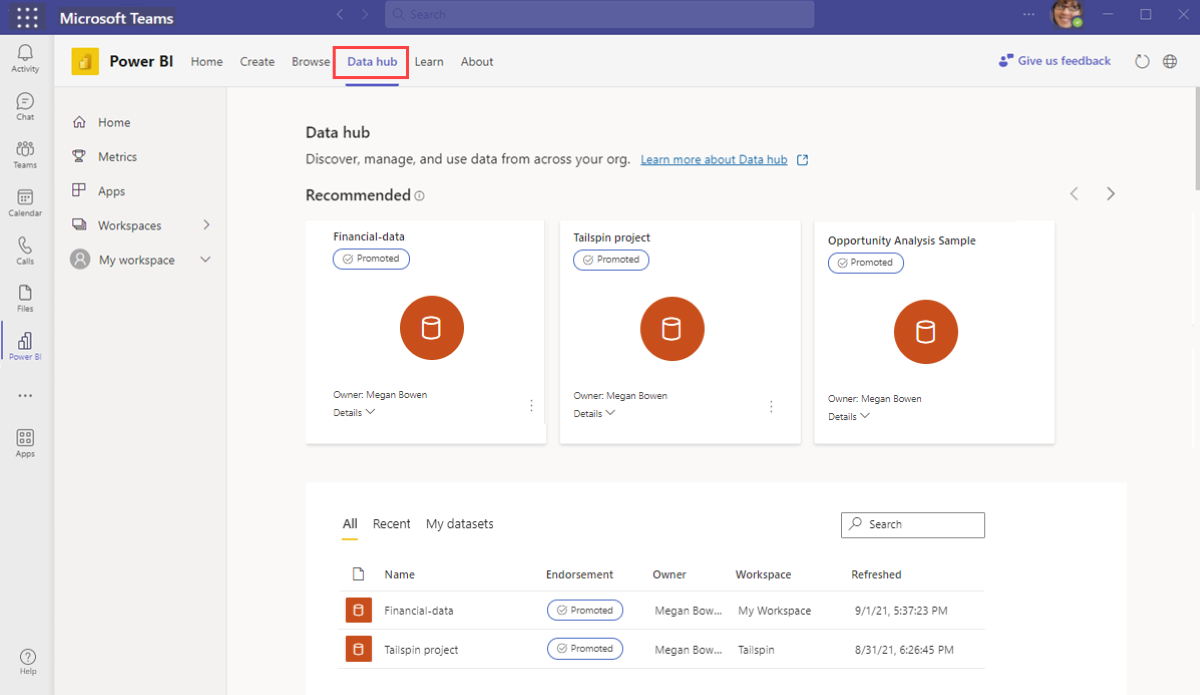
Go to the OneLake data hub tab.
Select a semantic model from the list or from the recommended semantic models.
Explore the Semantic model details page.
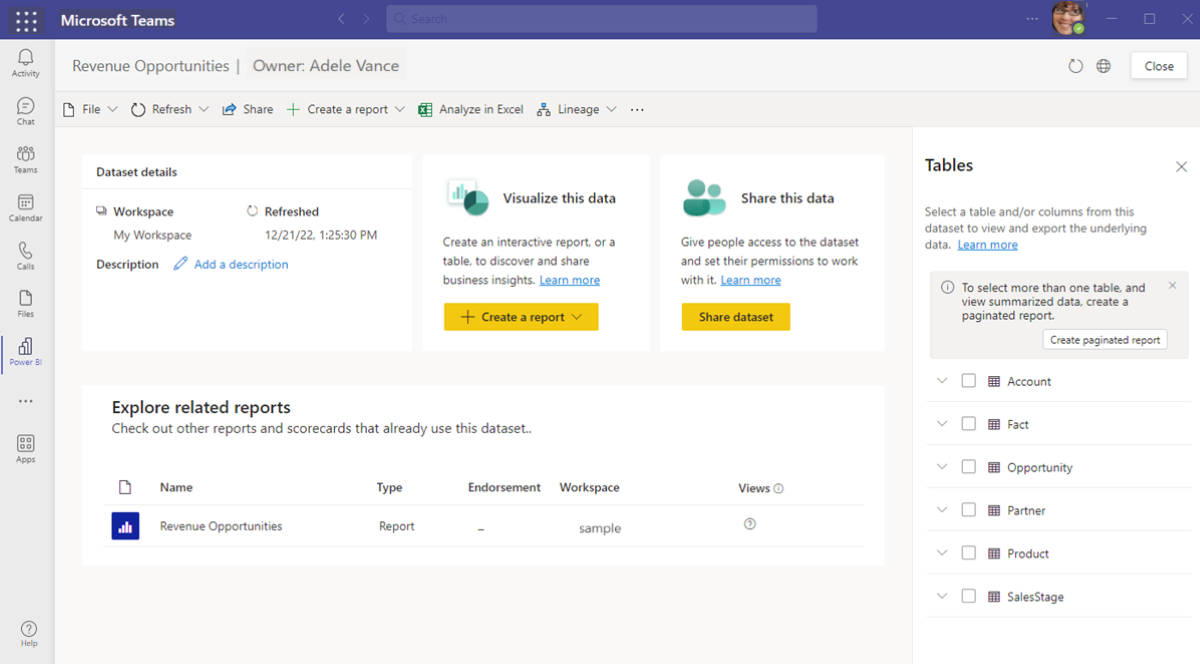
- Discover prebuilt reports that use the semantic model.
- Create a report in Power BI from the semantic model with Create a report.
- Share data and give people access to the semantic model to work.
- Select a table or column to export data or select more than one table to create a paginated report.


When you find interesting reports relevant to your team, bring them into your collaboration. Add them to channels, meetings, and chats as tabs or in a conversation.
Enhance reports in the Power BI service and in Teams
It’s easy to keep working on your reports right in the Power BI service and Power BI in Teams. Take advantage of the artificial intelligence capabilities built into Power BI.
Q&A visual
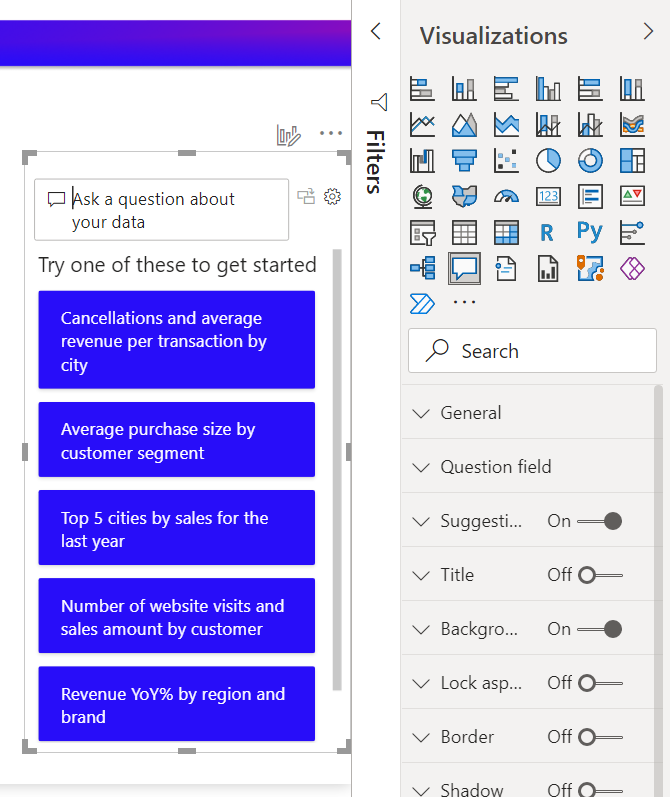
For example, ask a question about your data by adding a Q&A visual, where you can ask natural language questions and get answers in the form of a visual.
In the Visualizations pane, select the Q&A icon.
Power BI generates a list of suggested questions you can choose from or type your own.
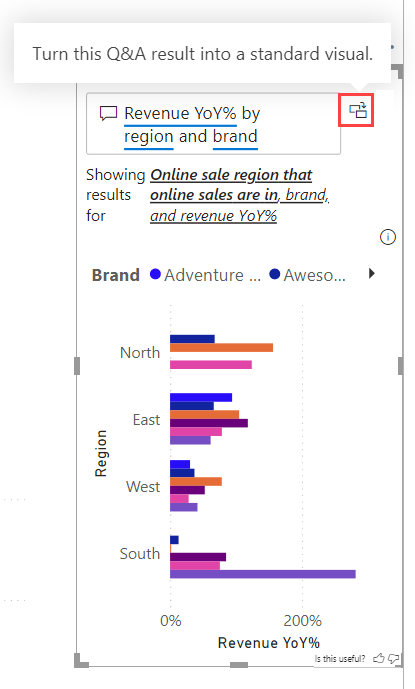
If you like the visual that Power BI creates, you can convert it from a Q&A visual to a standard visual on the page.
For more information, see Create a Q&A visual in a report in Power BI.
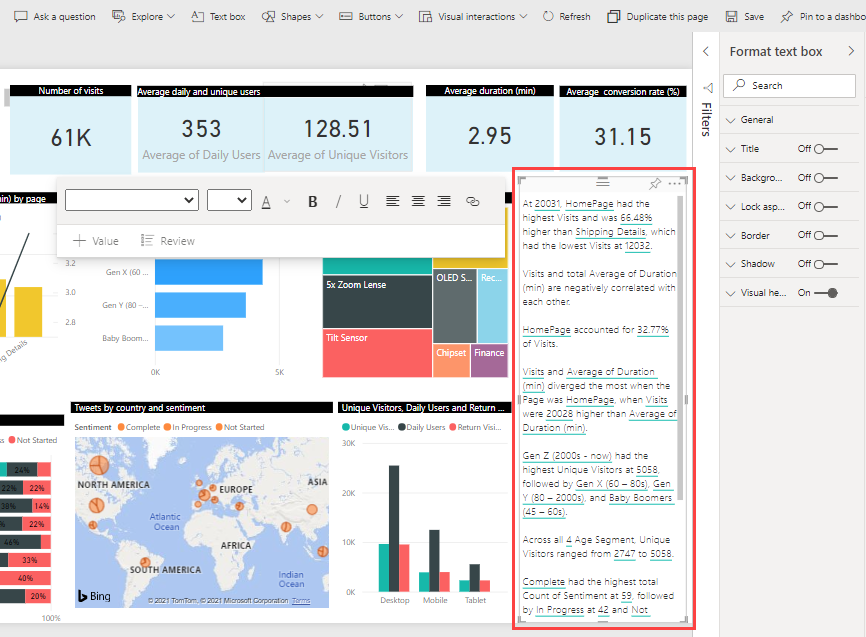
Smart narrative visual
You can also easily create a smart narrative visual, a dynamically generated text box that provides relevant insights that you can customize.
In the Visualizations pane, select the Smart narrative visual icon.
Power BI generates a text description of key takeaways in your report.
You can edit the visual, change the way it looks, and change the inline values it generates.

For more information, see Create smart narrative summaries.
Create sophisticated reports in Power BI Desktop
Power BI Desktop is a downloadable Windows app to make sophisticated reports. It's like PowerPoint, but it uses data visualizations to help you gain insights into your data. Power BI Desktop has powerful capabilities like data import, cleaning, modeling, and much more.
To get started with Power BI Desktop, follow these steps.
Install Power BI Desktop. You can download it from the Microsoft Store.
Create a report in Power BI Desktop.
In the following tutorial sample, you prepare and model your data. Then create a report based on the model you've created. You can't do both tasks in a report in the Power BI service.Tutorial: From dimensional model to stunning report in Power BI Desktop
Publish the report to the Power BI service.
Share the report with your colleagues in Teams.