Note
Access to this page requires authorization. You can try signing in or changing directories.
Access to this page requires authorization. You can try changing directories.
APPLIES TO: ![]() Power BI service for business users
Power BI service for business users ![]() Power BI service for designers & developers
Power BI service for designers & developers ![]() Power BI Desktop
Power BI Desktop ![]() Requires Pro or Premium license
Requires Pro or Premium license
There are two types of reports available on Power BI, Power BI reports and paginated reports.
Power BI reports are optimized for exploration and interactivity. A sales report where different salespeople want to slice the data in the same report for their specific region/industry/customer and see how the numbers change would be best served by a Power BI report.
Paginated reports are well suited for viewing reports as pages, printing as PDF, exporting to Excel, or generating documents. A sales detail report where you want to see row-level detail data for specific region/industry/customer and perhaps export it to Excel or print as accessible PDF would be best served by a paginated report.
Identify a paginated report
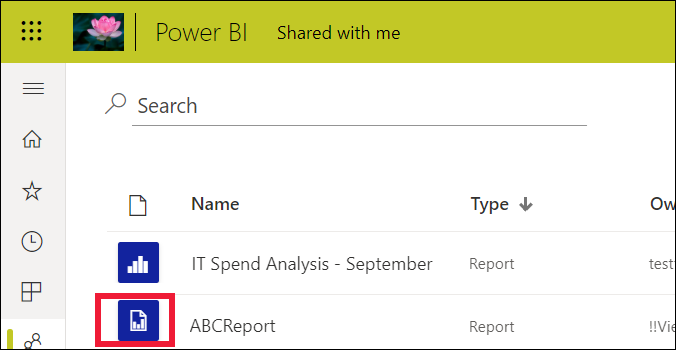
In content lists and on your Home landing page, paginated reports can be identified by their icon ![]() . A paginated report can be shared with you directly, or as part of a Power BI app. If the report designer gave you permissions, you'll be able to re-share the paginated report and subscribe yourself and others.
. A paginated report can be shared with you directly, or as part of a Power BI app. If the report designer gave you permissions, you'll be able to re-share the paginated report and subscribe yourself and others.
What is a paginated report?
These reports are called paginated because they're formatted to fit well on a printed page. One advantage is that they display all the data in a table, even if the table spans multiple pages. Report designers can control the report page layout exactly.
Paginated reports are best for scenarios that require a highly formatted, print-ready output optimized for printing or PDF generation. A profit and loss statement is a good example of the type of report you would probably want to see as a paginated report.
How do paginated reports work?
When report designers create a paginated report, they're really creating a report definition. It doesn't contain the data. It specifies where to get the data, which data to get, and how to display the data. When you run the report, the report processor takes the report definition, retrieves the data, and combines it with the report layout to generate the report. Sometimes, the report displays default data. Other times you need to enter parameters before the report can display any data.
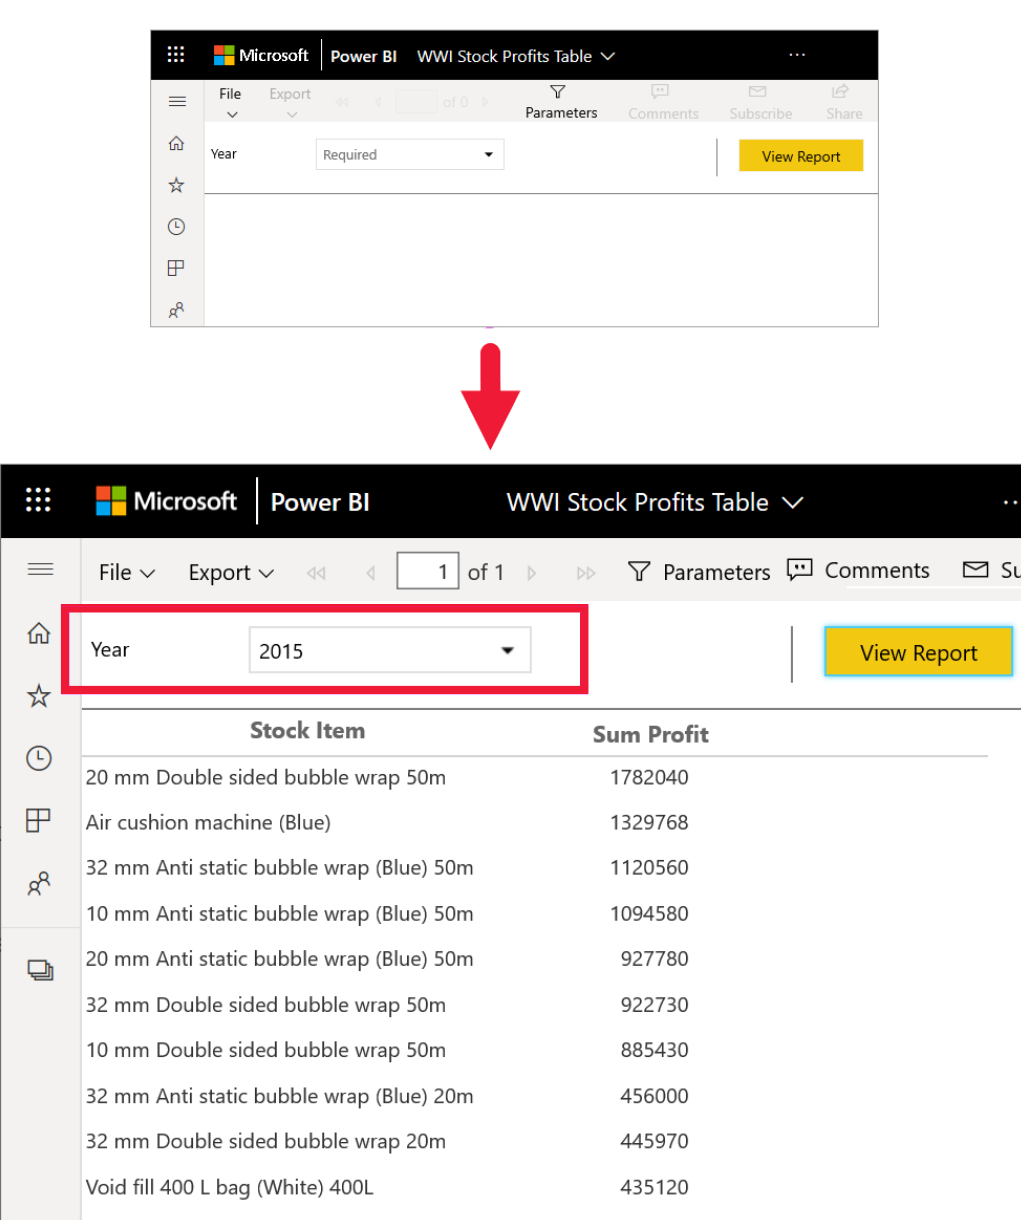
Select a paginated report to open it in the Power BI service. If it has parameters, you need to select them before you can view the report.
And that's typically the extent of the interaction - setting the parameters. If you're a billing analyst, you might use paginated reports to create or print invoices. If you're a sales manager, you might use paginated reports to view orders by store or sales person.
This simple paginated report generates profit by year after you select the Year parameter.
Compared to paginated reports, Power BI reports are much more interactive. Power BI reports allow for ad hoc reporting, and support more types of visuals, including custom visuals.
Interact with a paginated report
The way you interact with a paginated report is different from other reports. You can do things like print, bookmark, export, and comment, but there's less interactivity. Often, paginated reports require input from you to populate the report canvas. Other times the report displays default data and you can enter parameters to see different data.
Print a paginated report
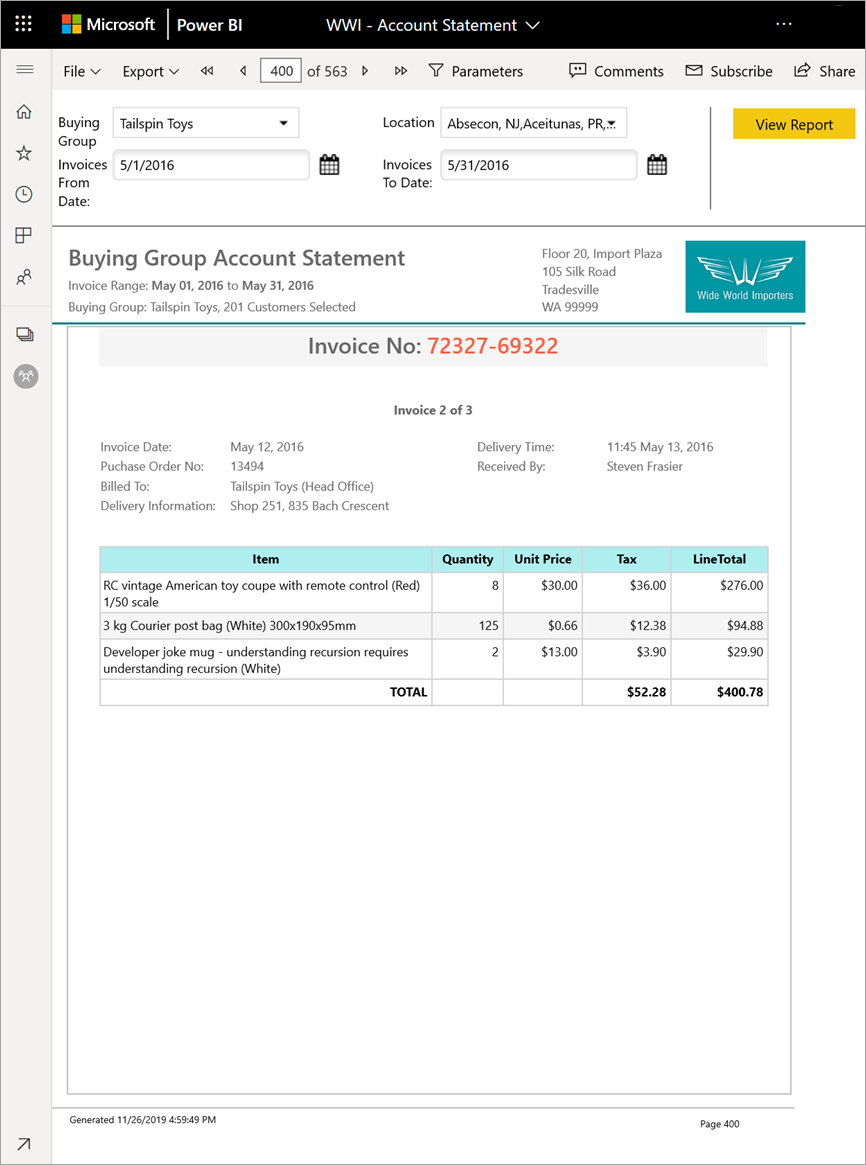
Paginated reports are formatted to fit well on a page and to print well. What you see in the browser is what you see when you print. Plus, if the report has a long table, the entire table prints, even if it spans multiple pages.
Paginated reports can have many pages. For example, this report has 563 pages. Each page is laid out exactly, with one page per invoice and repeating headers and footers. When you print this report, you'll get page breaks between invoices.
Navigate the paginated report
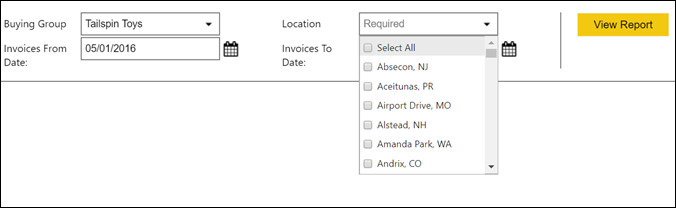
In this sales order report, there are three parameters: Business type, Reseller, and Order number.
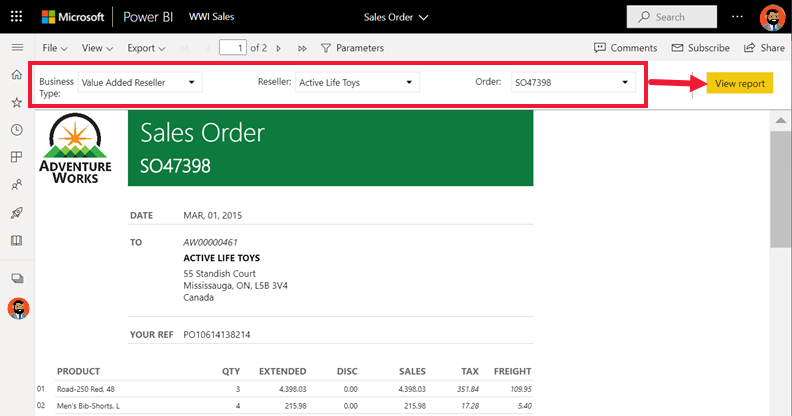
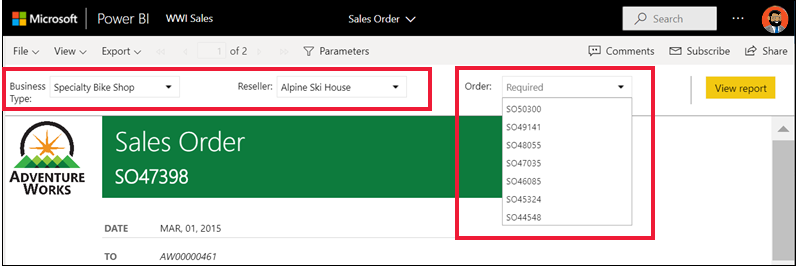
To change the information shown, enter new values for the three parameters and select View report. Here, we've selected Specialty bike shop, Alpine Ski House, and order number SO46085. Select View report to refresh the report canvas with the new sales order.
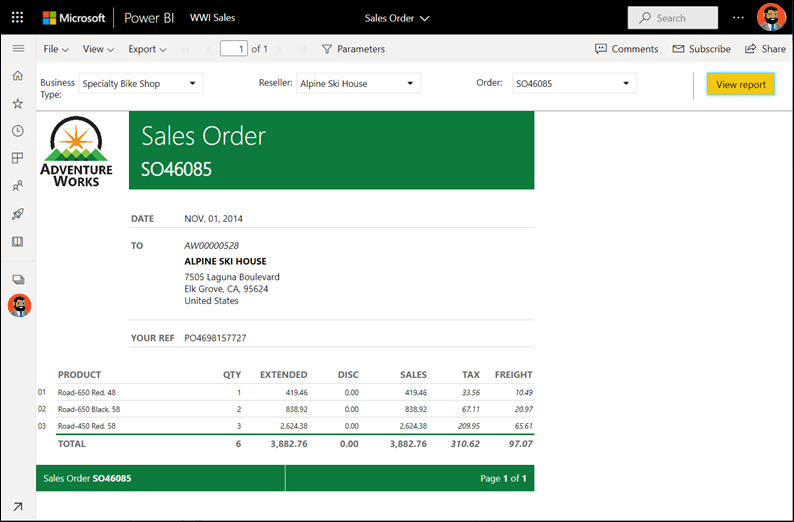
The new sales order shows the parameters we selected.
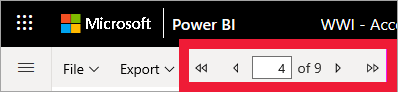
Some paginated reports have many pages. Use the page controls to navigate through the report.
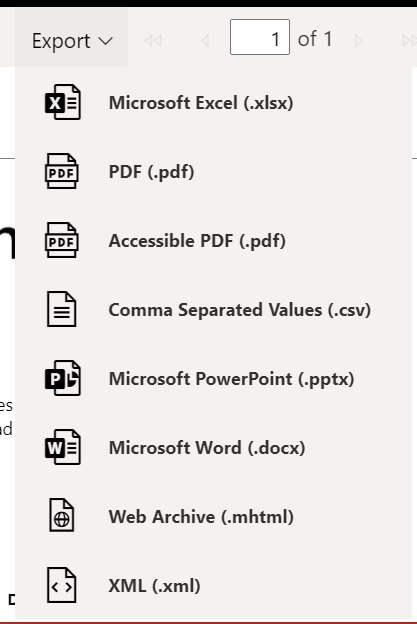
Export the paginated report
You have a variety of options for exporting paginated reports, including PDF, Word, XML, PowerPoint, and Excel. When you export, as much of the formatting as possible is preserved. Paginated reports exported to Excel, Word, PowerPoint, MHTML, and PDF, for example, keep their formatting.

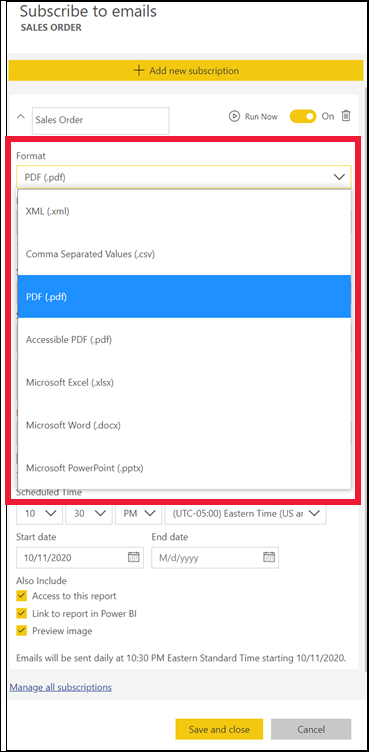
Subscribe to the paginated report
When you subscribe to a paginated report, Power BI sends you an email with the report as an attachment. When you set up your subscription, you choose how often you want to receive the emails: daily, weekly, hourly, or monthly. The subscription contains an attachment of the entire report output, up to 25MB in size. Export the entire report, or choose the parameters ahead of time. Choose from many attachment types, like Excel, PDF, and PowerPoint.
Considerations and troubleshooting
A paginated report can appear blank until you select parameters and choose View report.
If you don't have any paginated reports, check out these sample paginated reports that you can import to your workspace.
Related content
- Power BI reports
- Paginated reports in Power BI: FAQ
- More questions? Try the Power BI Community.