Note
Access to this page requires authorization. You can try signing in or changing directories.
Access to this page requires authorization. You can try changing directories.
APPLIES TO: ![]() Power BI Desktop
Power BI Desktop ![]() Power BI service
Power BI service
The public preview of modern visual tooltips includes data point drill actions and updated styling to match your report theme.
Video
Sujata demonstrates how the modern visual tooltips work in this video.
Note
This video might use earlier versions of Power BI Desktop or the Power BI service.
Turn on the new tooltips
When you enable this preview, new reports have modern tooltips enabled by default. However, to have the new tooltips in existing reports, you need to enable them for each report.
- For new reports in Power BI Desktop
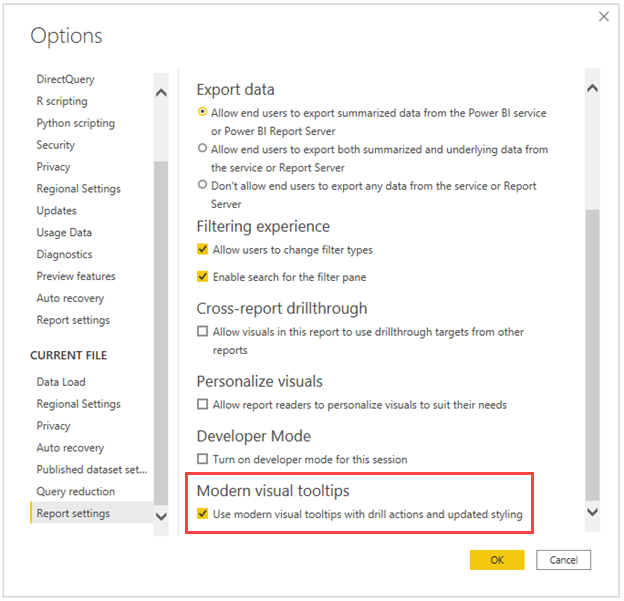
- For existing reports in Power BI Desktop
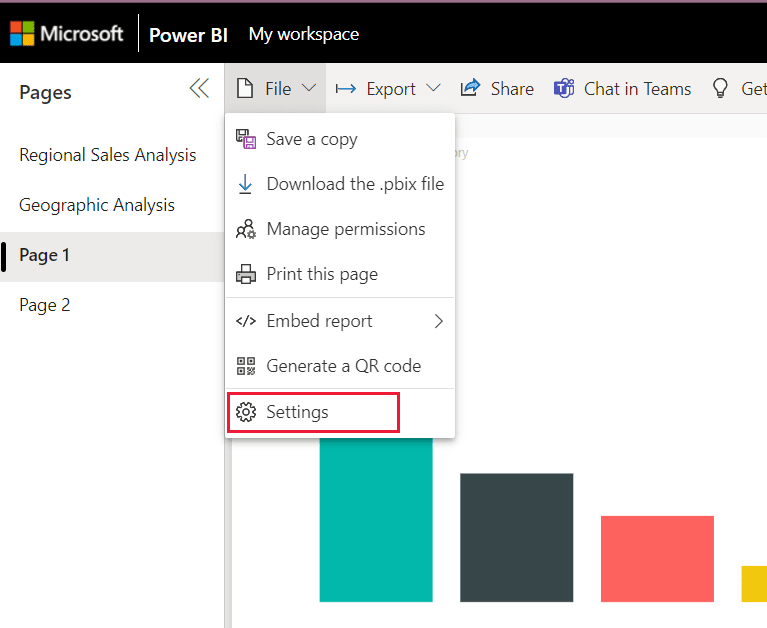
- For reports in the Power BI service
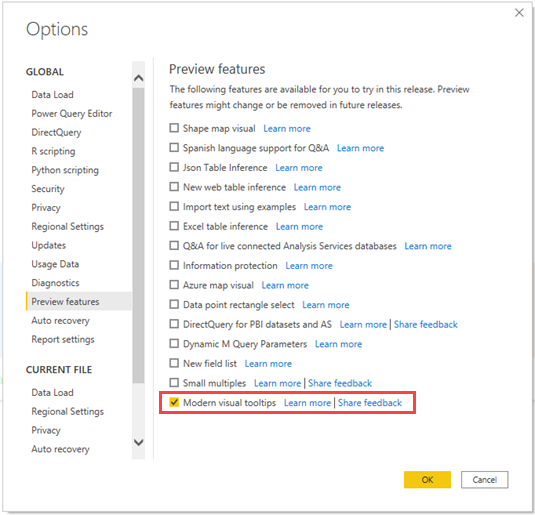
In Power BI Desktop, go to File > Options and settings > Options > Preview features.
Select the Modern visual tooltips checkbox.
Restart Power BI Desktop.

Drill actions
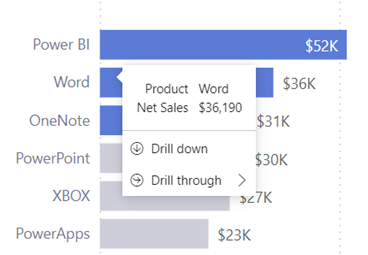
When you enable these new tooltips, you can drill down and up, and drill through on a data point without having to use the right-click menu or the header for the visual.
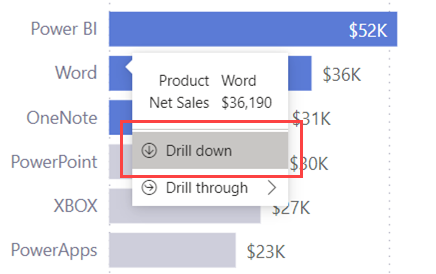
For example, when you hover over the Word data point in a bar chart, you can Drill down on the data point or Drill through. If you select Drill down, the visual updates to display the next level in the hierarchy and filter to Word.
If you select Drill through, you see which pages you can drill through to. In this example, choose either the Market Basket Analysis or the Category Details page.
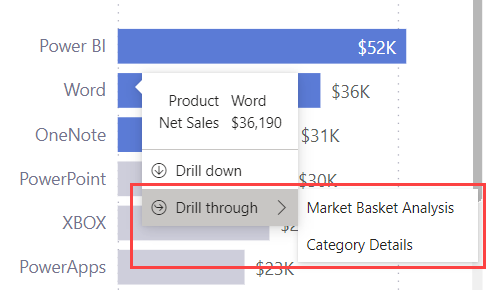
If you select Market Basket Analysis in the tooltip, you drill through to the Market Basket Analysis page, filtered to Word and any other filters on the source data point.

Updated styling
Once you upgrade to the new tooltips, you might notice an updated styling that's based on the report’s theme colors:
- The background of the tooltips default to the Background elements.
- The text and icon color of the tooltips default to the First-level elements.
- The separator line and hover color on the tooltip default to the Secondary background elements.
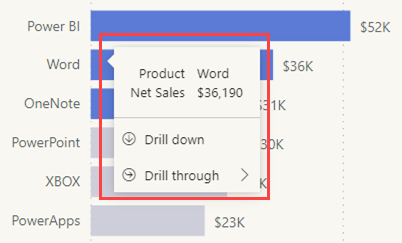
For example, this tooltip has the Default theme style:
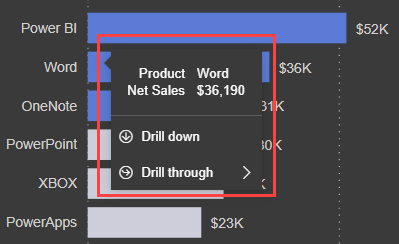
Here’s an example with the Innovate theme:
Here’s an example with the Frontier theme:
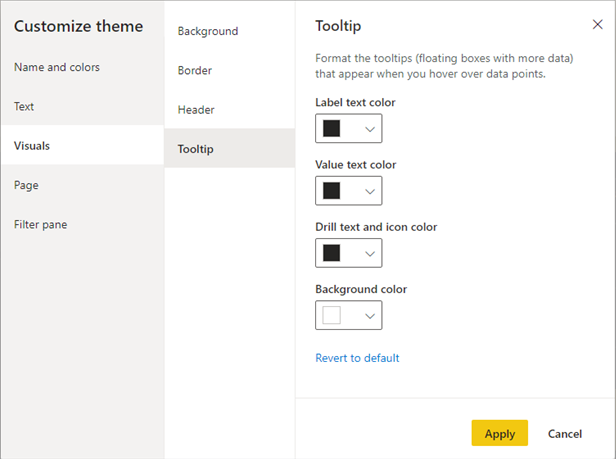
To customize the styling further in Power BI Desktop, you can update the Tooltip theme in the Customize theme dialog:
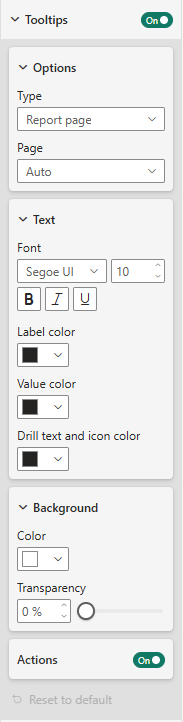
Additionally, you can format tooltips per visual by customizing the settings in the Format pane:
Considerations and limitations
Drill actions aren't available in the tooltip for the following scenarios:
- Report page tooltips
- AppSource visuals (custom visuals)
- Decomposition trees
We don't have visual-level control to turn on or off the drill actions for the tooltips. You can enable or disable this capability for a whole report.