Note
Access to this page requires authorization. You can try signing in or changing directories.
Access to this page requires authorization. You can try changing directories.
Use the Page visuals pane to create a layout for your mobile-optimized view.
The Page visuals pane
The Page visuals pane lists all of the visuals, both shown and hidden, that are on the original report page. The following features help you start creating your mobile-optimized view:
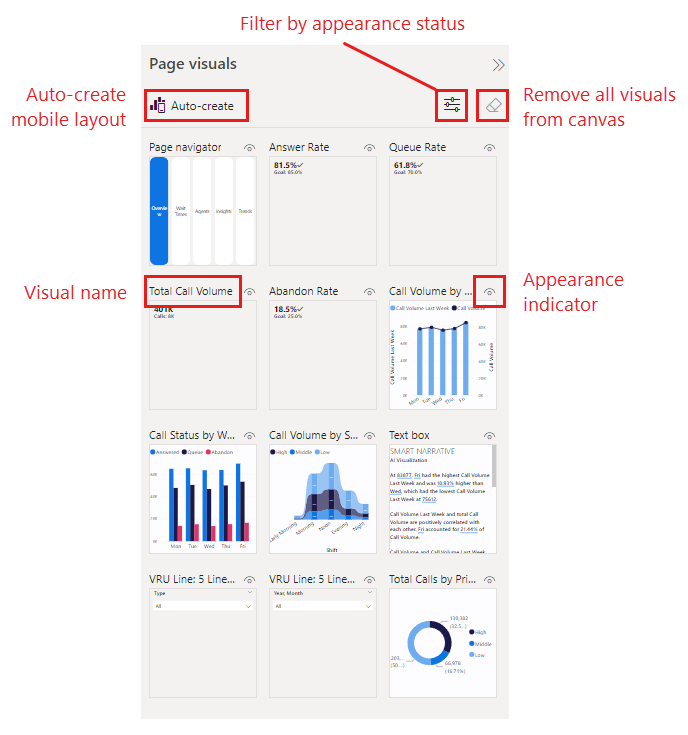
- Auto-create: Creates a mobile layout using the visuals in your report. Any visuals that are already on the canvas will be removed. If you aren't satisfied with the auto-generated layout, you can use Undo (Ctrl+Z) to go back to the previous layout. The automatically generated layout is intended to help you get started creating a mobile-optimized view for a report, and the quality of the layout depends on a number of factors. For more information, see Automatic mobile layout creation.
- Visual name: Helps to identify the visual.
- Appearance status: Indicates the appearance status of the visual—visible or hidden. This indicator changes depending on the appearance status of the visual in the current state of the web report view. The appearance indicator is useful when working with bookmarks.
- Filter by appearance status: Filters the visuals according to appearance status, making it easier to find a visual.
- Remove all visuals from canvas: Removes all visuals from the canvas. Removing visuals from the canvas doesn't remove them from the Page visuals pane. They remain available for you to use.
Lay out visuals on the canvas
To create your layout, you can either use the auto-create option to get a complete, automatically generated initial layout that you can then modify as necessary, or you can start placing the visuals on the canvas manually, dragging and dropping them from the page visuals pane onto the mobile layout canvas. When you drag a visual to the canvas, by default, it snaps to the grid. Alternatively, you can double-click the visual on the page visuals pane, and it will be added to the canvas.
Once a visual has been placed on the canvas, you can resize it by selecting it and dragging the handles that appear around the edge of the visual. To maintain the visual's aspect ratio while resizing, press the Shift key while dragging the resize handles.
Each time you drag a visual onto the canvas, it's added on its own layer on top of any other visuals that are already on the canvas. Visuals can be layered one on top of the other to create interactive reports using bookmarks or to build attractive reports by layering visuals over images. Use the Selection pane to change the layering order of the visuals.
The following animation illustrates dragging, dropping, resizing, and overlaying visuals from the Page visuals pane onto the canvas.
Note
- You can add some or all of the visuals in the Page visuals pane to the mobile-optimized report page.
- You can drag and drop hidden visuals onto the canvas. They'll be placed, but not shown unless their visibility status changes in the current desktop report view.
- The canvas is interactive, so you can test the behavior of buttons, slicers, and other visuals. Some limitations apply.
Remove visuals from the mobile layout canvas
To remove a single visual from the mobile layout, select the X in the top-right corner of the visual on the phone canvas, or select the visual and press Delete.
To remove all the visualizations from the canvas, select the eraser on the Page visuals pane.
Removing visuals from the mobile layout canvas removes them from the mobile layout canvas only. The visuals remain available for use in the Page visuals pane, and the original desktop layout report remains unaffected.