Note
Access to this page requires authorization. You can try signing in or changing directories.
Access to this page requires authorization. You can try changing directories.
APPLIES TO: ![]() Power BI Desktop
Power BI Desktop ![]() Power BI service
Power BI service
By adding a tile to your dashboard, you can place an image, text box, video, streaming data, or web code on your dashboard. This article takes you through the steps of adding different types of content to dashboards, making them more informative, interactive, and visually appealing.
Note
You must have permission to edit the dashboard, or you won't see the same options described here. Certain content might also be disabled by your administrator.
Add an image, video, or other tile
You can add an image, text box, video, streaming data, or web code directly to your dashboard.
Select the arrow next to Edit in the top menu, then select Add a tile.
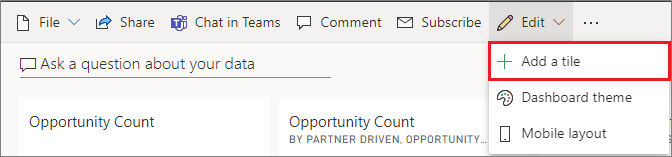
Select which type of tile to add:

Add an image
If you want to add your company logo or some other image to your dashboard, save the image file online and link to it. Make sure security credentials aren't required to access the image file. For example, because OneDrive and SharePoint require authentication, images stored there can't be added to a dashboard this way. Host your image on a web server where they can be accessed via public URLs without authentication.
Note that images can't be in .svg format.
From the Add a tile window, select Image > Next.
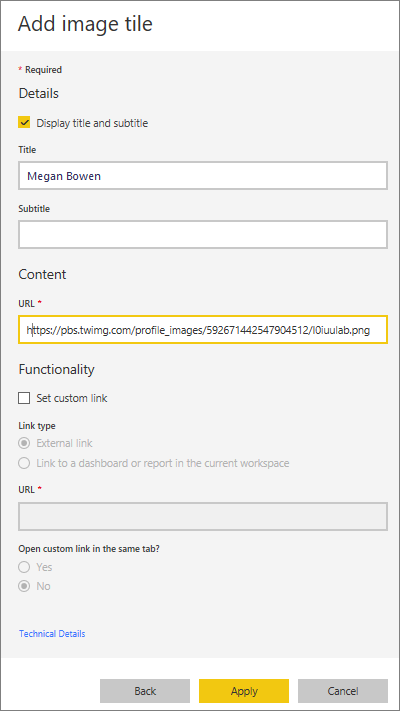
From the Add image tile window, add the image information:
a. To display a title above the image, select Display title and subtitle and enter a Title and an optional Subtitle.
b. Enter the image URL.
c. To make the tile a hyperlink, select Set custom link and enter the URL.
When colleagues click the image or title, they'll be taken to this URL.
d. Select Apply.
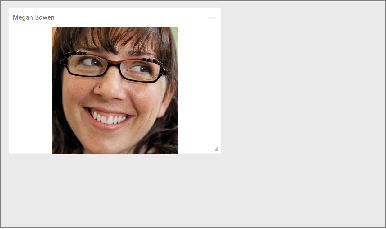
On the dashboard, resize and move the image as needed.
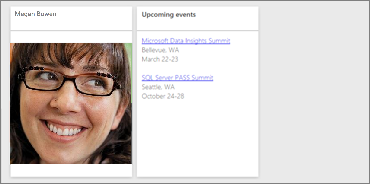
Add a text box or dashboard heading
To add a dashboard heading, type your heading in the text box and increase the font.
From the Add a tile window, select Text box > Next.
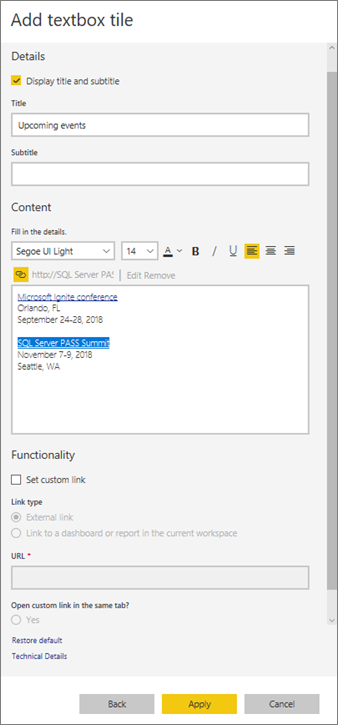
Format the text box:
a. To display a title above the text box, select Display title and subtitle and enter a Title and an optional Subtitle.
b. Enter and format Content for the text box.
c. Optionally, set a custom link for the title. A custom link can be an external site or a dashboard or report in your workspace. However, in this example we've added hyperlinks within the text box itself, so we'll leave Set custom link unchecked.
d. Select Apply.
On the dashboard, resize and move the text box as needed.
Add a video
When you add a YouTube or Vimeo video tile to your dashboard, the video plays right on your dashboard.
From the Add a tile window, select Video > Next.
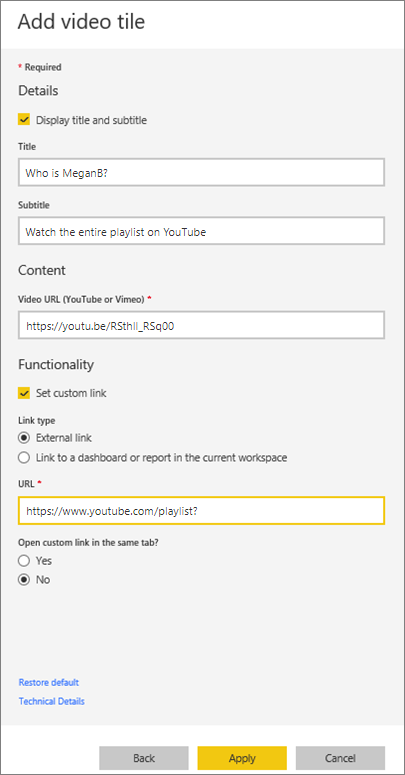
Add video information in the Add video tile window:
a. To display a title and subtitle at the top of the video tile, select Display title and subtitle and enter a Title and an optional Subtitle. In this example, we'll add a Subtitle, and then convert it to a hyperlink to the entire YouTube playlist.
b. Enter the Video URL for the video.
c. Add a hyperlink for the Title and Subtitle, so that your colleagues can view the entire playlist on YouTube after they watch the embedded video. To do so, under Functionality, select Set custom link, and then enter the URL for the playlist.
d. Select Apply.
On the dashboard, resize and move the video tile as needed.
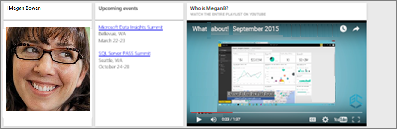
Select the video tile to play the video.
Select the subtitle to visit the playlist on YouTube.
Add streaming data
You can add streaming data, such as Twitter feeds or sensor data, to a tile in your dashboard. This example of real-time streaming in Power BI using a publicly available stream from PubNub has detailed instructions to get you started. Read the rest of that article to learn more about real-time streaming options in Power BI.
Add web content
You can paste or type in any HTML content, as a tile, to your report or dashboard. Enter the embed code manually or copy/paste from sites such as Twitter, YouTube, embed.ly, and so on.
From the Add a tile window, select Web content > Next.
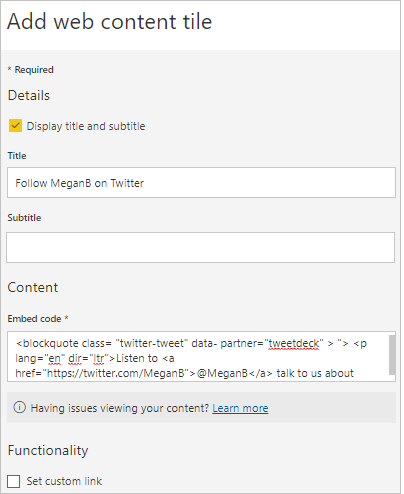
Add information to the Add web content tile window:
a. To display a title above the tile, select Display title and subtitle and enter a Title and an optional Subtitle.
b. Enter the embed code. In this example, we're copying and pasting a Twitter feed.
c. Select Apply.
On the dashboard, resize and move the web content tile as needed.
Tips for embedding web content
For iframes, use a secure source. If you enter your iframe embed code and get a blank tile, verify you're not using http for the iframe source. If you are, change it to https.
<iframe src="https://xyz.com">Edit width and height information. The embed code embeds a video and sets the video player to 560 x 315 pixels. This size doesn't change as you resize the tile.
<iframe width="560" height="315"
src="https://www.youtube.com/embed/Cle_rKBpZ28" frameborder="0"
allowfullscreen></iframe>
If you'd like the player to resize to fit the tile size, set the width and height to 100%.
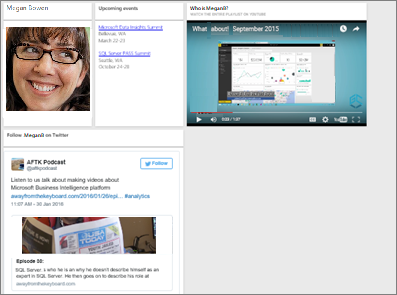
<iframe width="100%" height="100%"
src="https://www.youtube.com/embed/Cle_rKBpZ28" frameborder="0"
allowfullscreen></iframe>
This code embeds a tweet and retains, as separate links on the dashboard, links for the AFK podcast, @MeganB's Twitter page, Follow, #analytics, reply, retweet, and like. Selecting the tile itself takes you to the podcast on Twitter.
<blockquote class="twitter-tweet" data-partner="tweetdeck"> <p lang="en" dir="ltr">Listen to <a href="https://twitter.com/MeganB">@MeganB</a> talk to us about making videos about Microsoft Business Intelligence platform <a href="https://t.co/TmRgalz7tv">https://t.co/TmRgalz7tv </a> <a href="https://twitter.com/hashtag/analytics?src=hash"> #analytics</a></p>— AFTK Podcast (@aftkpodcast) <a href="https://twitter.com/aftkpodcast/status/693465456531771392"> January 30, 2016</a></blockquote> <script async src="//platform.twitter.com/widgets.js" charset="utf-8"></script>
Edit a tile
To make changes to an existing tile:
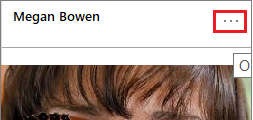
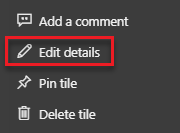
Hover over the top-right corner of the tile to display the ellipsis (...), then select it to show the More options menu.
Select Edit details to display the Tile details window and make changes.
Considerations and troubleshooting
- To make it easier to move the tile on your dashboard, add a title and an optional subtitle.
- If you'd like to embed content from a website, but the website doesn't provide embed code to copy and paste, see embed.ly for help with generating the embed code.
- Make sure security credentials aren't required to access the image file. For example, because OneDrive and SharePoint require authentication, images stored there can't be added to a dashboard this way.
- Images can't be in .svg format.
Related content
More questions? Try the Power BI Community.