Note
Access to this page requires authorization. You can try signing in or changing directories.
Access to this page requires authorization. You can try changing directories.
APPLIES TO: ![]() Power BI Desktop
Power BI Desktop ![]() Power BI service
Power BI service
Metrics support cascading scorecards that roll up along hierarchies you set up in your scorecard. You can set up a hierarchy for a scorecard and map the Power BI semantic models referenced by your goals to the hierarchy levels and owner fields, automatically creating a new scorecard view for each slice of your data.
Prerequisites for creating hierarchies
Here are the requirements for setting up a hierarchical scorecard:
- Hierarchies require a Premium or Premium Per User workspace.
- You need Edit permissions to the scorecard.
- Your scorecard needs at least one connected goal.
- You need Build access to the semantic models connected in your scorecard.
How hierarchies look in Scorecards
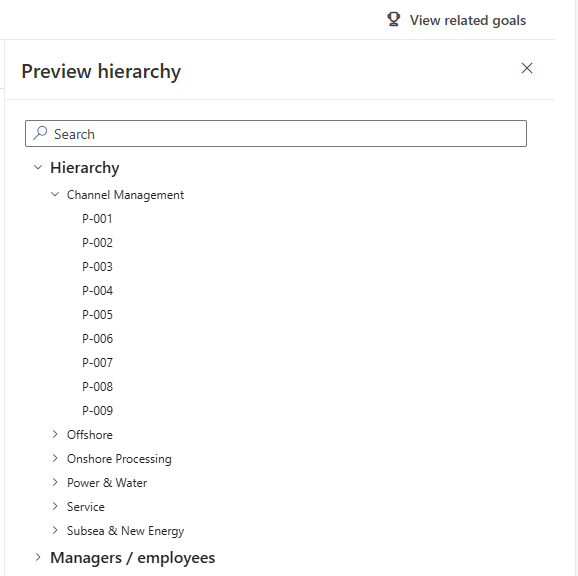
Power BI will cascade connected goals to each level of the hierarchy. Users can easily drill into the hierarchy to see progress, statuses, and do check-ins at different levels. In the following images, you see the different levels of a project hierarchy in the slicer. As you go to each goal or sublevel of the hierarchy, your metric values, statuses, owners, and progress will change along with it.
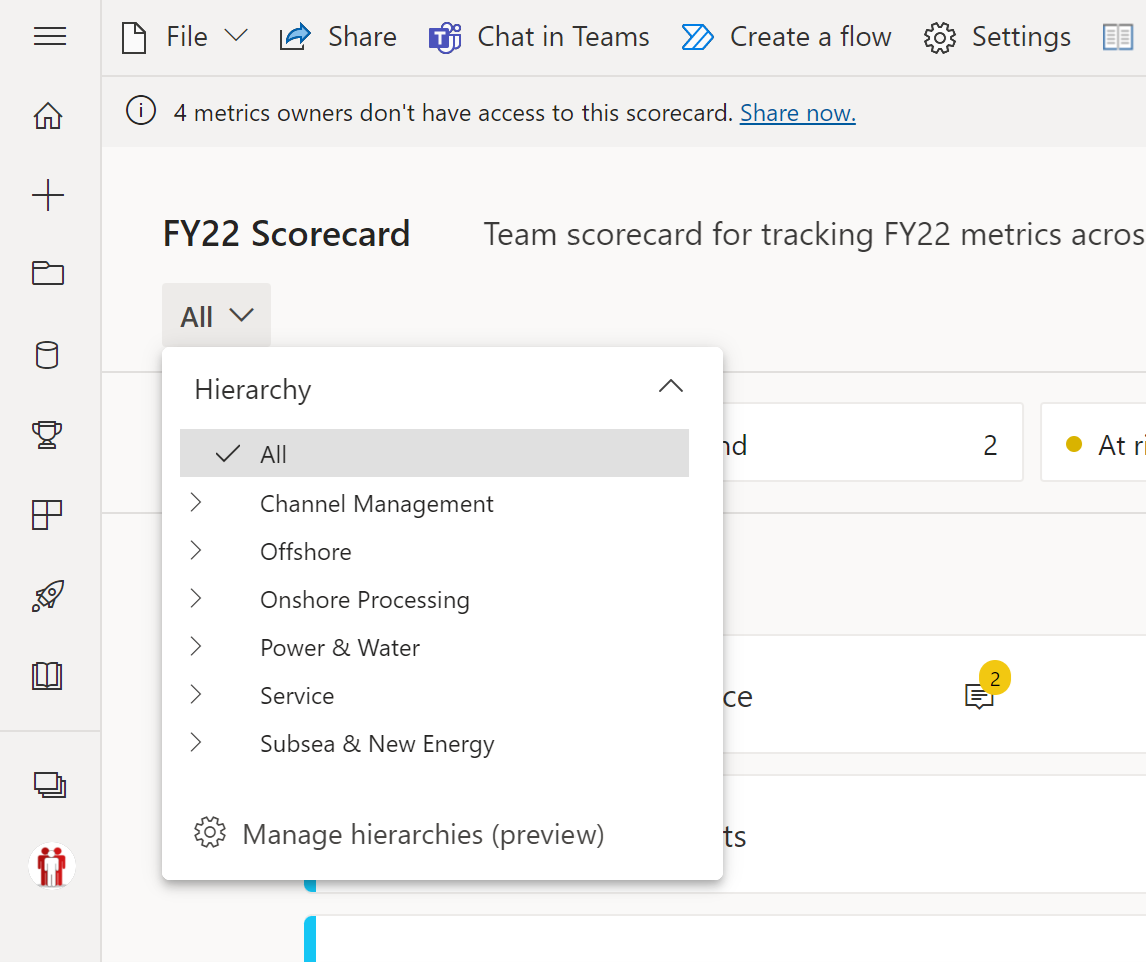
This scorecard is set up with a hierarchy, and the filter is open exposing the hierarchy slicer:

In this image, the filter is open exposing the hierarchy slicer and filters applied on the scorecard:

Set up your hierarchy (preview)
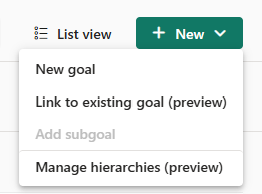
In scorecard edit mode, select Set up a hierarchy from the New menu.
You can also select Manage hierarchies from the All slicer.
Map hierarchy levels to data
Start setting up your hierarchy by giving it a name, building the levels, and mapping them to connected semantic models in your scorecard. You can build multiple hierarchies to see cross sections between slices of data, for example if there's a geography and product hierarchy, you can use the slicer to view a scorecard showing your metrics by "laptops in Germany" or "smart devices in Seattle, WA."
In the setup experience, you see all the semantic models that are connected to metrics in the scorecard.
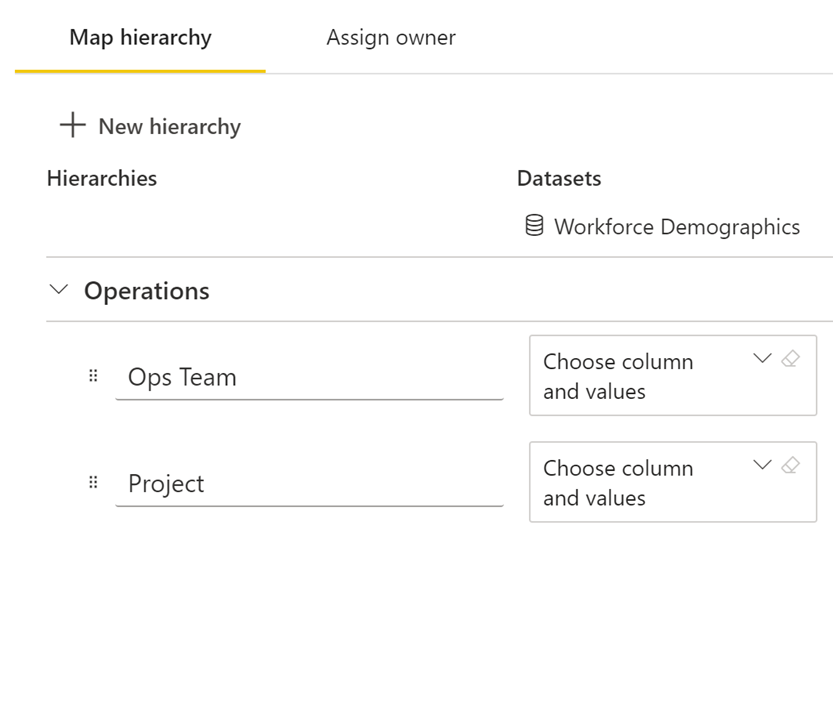
Map the data in your underlying semantic models to your hierarchy levels. If there are fields you don’t want to bring into the mapping, you can deselect them using the checkboxes in the fields list.
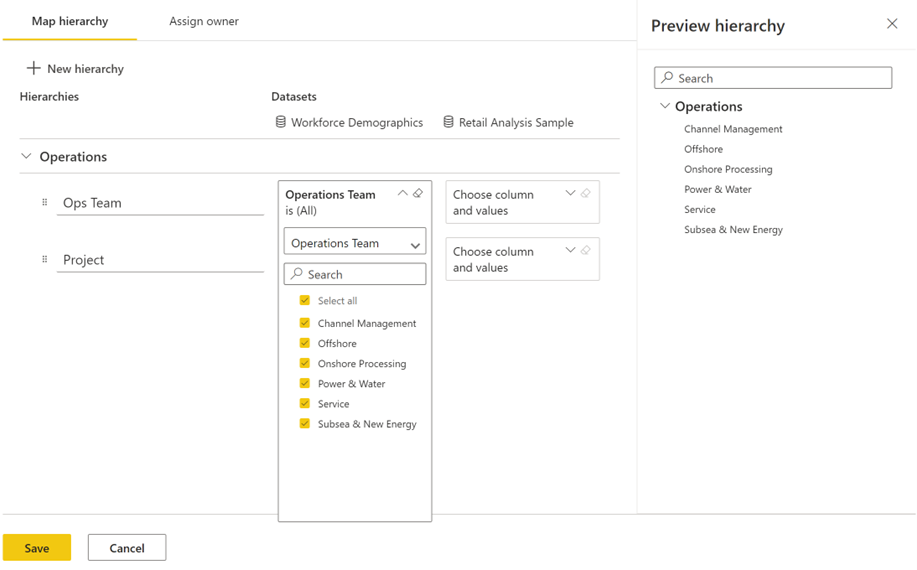
As you map your semantic models to the corresponding data in each hierarchy level, you see a preview on the right-hand pane to double check you’re on the right track.
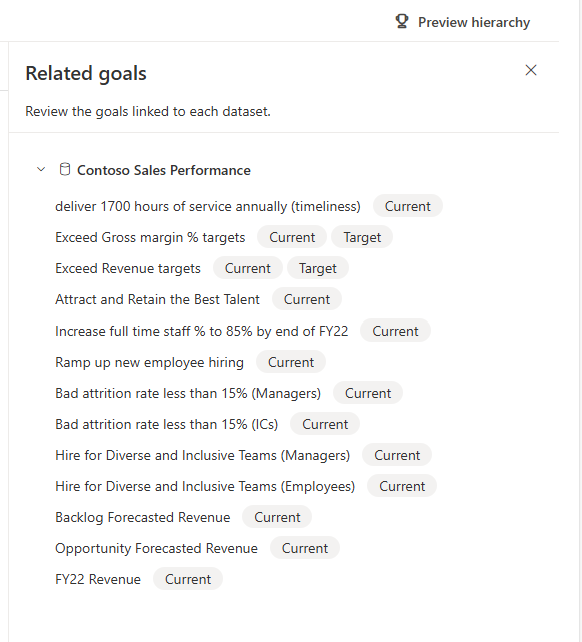
There's also an option in the upper right to view related metrics, showing an overview of the metrics on your scorecard, which values are connected to data, and which semantic model they come from.
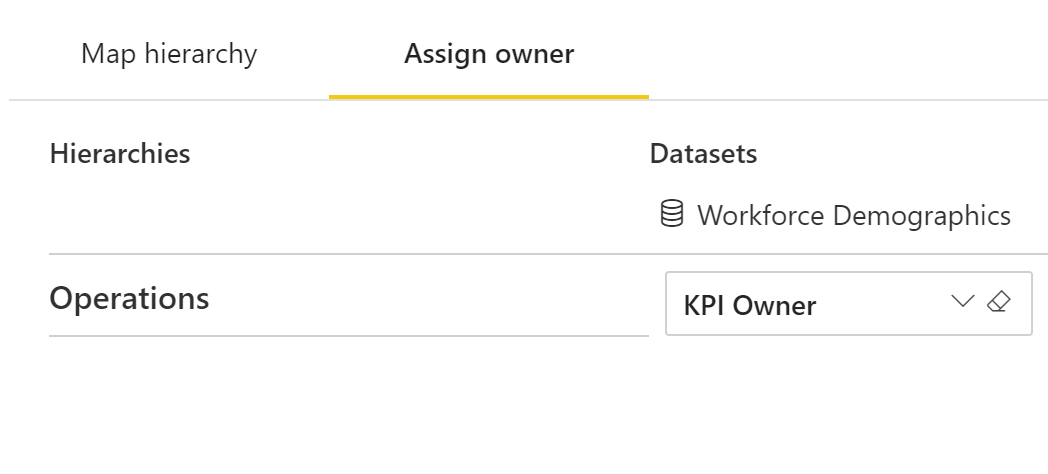
Map owners
You can map owners in the assign owners section so the owner column dynamically changes with each slice of the data. Owners are mapped per hierarchy, so for an owner mapping to work correctly, there needs to be a relationship between the owner field and the hierarchy data in the underlying semantic models. Owner mappings apply per hierarchy level, not per metric.
Save your hierarchy and watch as all the connected values and owners dynamically change. Hierarchies support manual goals (goals not connected to data) as well – manual goals show up on child scorecards but show the manual values as blank. These goals can be checked-in and updated on the child scorecard views.
Other metric data inherited from original scorecard:
- Metric metadata: name, owners, statuses, and start and due dates
- Data connections
- Status rules
- Tracking settings
Metric data that can be edited on child scorecards:
- Check-in data: notes, statuses when applicable, and values when applicable.
Considerations and limitations
There are data limits on hierarchies:
- Up to 10,000 items per hierarchy (across all semantic models)
- Up to five hierarchies
- Up to five levels per hierarchy
Dynamic and static row-level security (RLS) is supported but is routed through the hierarchy creator. All scorecard viewers impersonate the hierarchy creator’s access.
Other users with edit access to the scorecard can edit the hierarchy, but their changes take over the hierarchy connections upon save, and all data. Connections are routed through their UserID, which might result in different data values or broken metrics.
Reusing Power BI hierarchies isn't yet supported. You have to create hierarchies in each scorecard.
For hierarchies to reflect proper changes, you need to have established relationships between the hierarchy fields in the underlying data. This is true for owners as well.
Hierarchies aren't included in the scorecard semantic model.
Owners mapped in the hierarchy don't automatically receive permissions to the scorecard.
Owners are applied per hierarchy level, not per metric.
Roll ups aren't yet supported on child scorecards.